Topology & step-through
The Topology tab draws the processor's node graph and shows what a cycle did to it. The log tells you which nodes logged, and in what order; the graph tells you how they are wired — and therefore what the log implies about everything that stayed quiet.
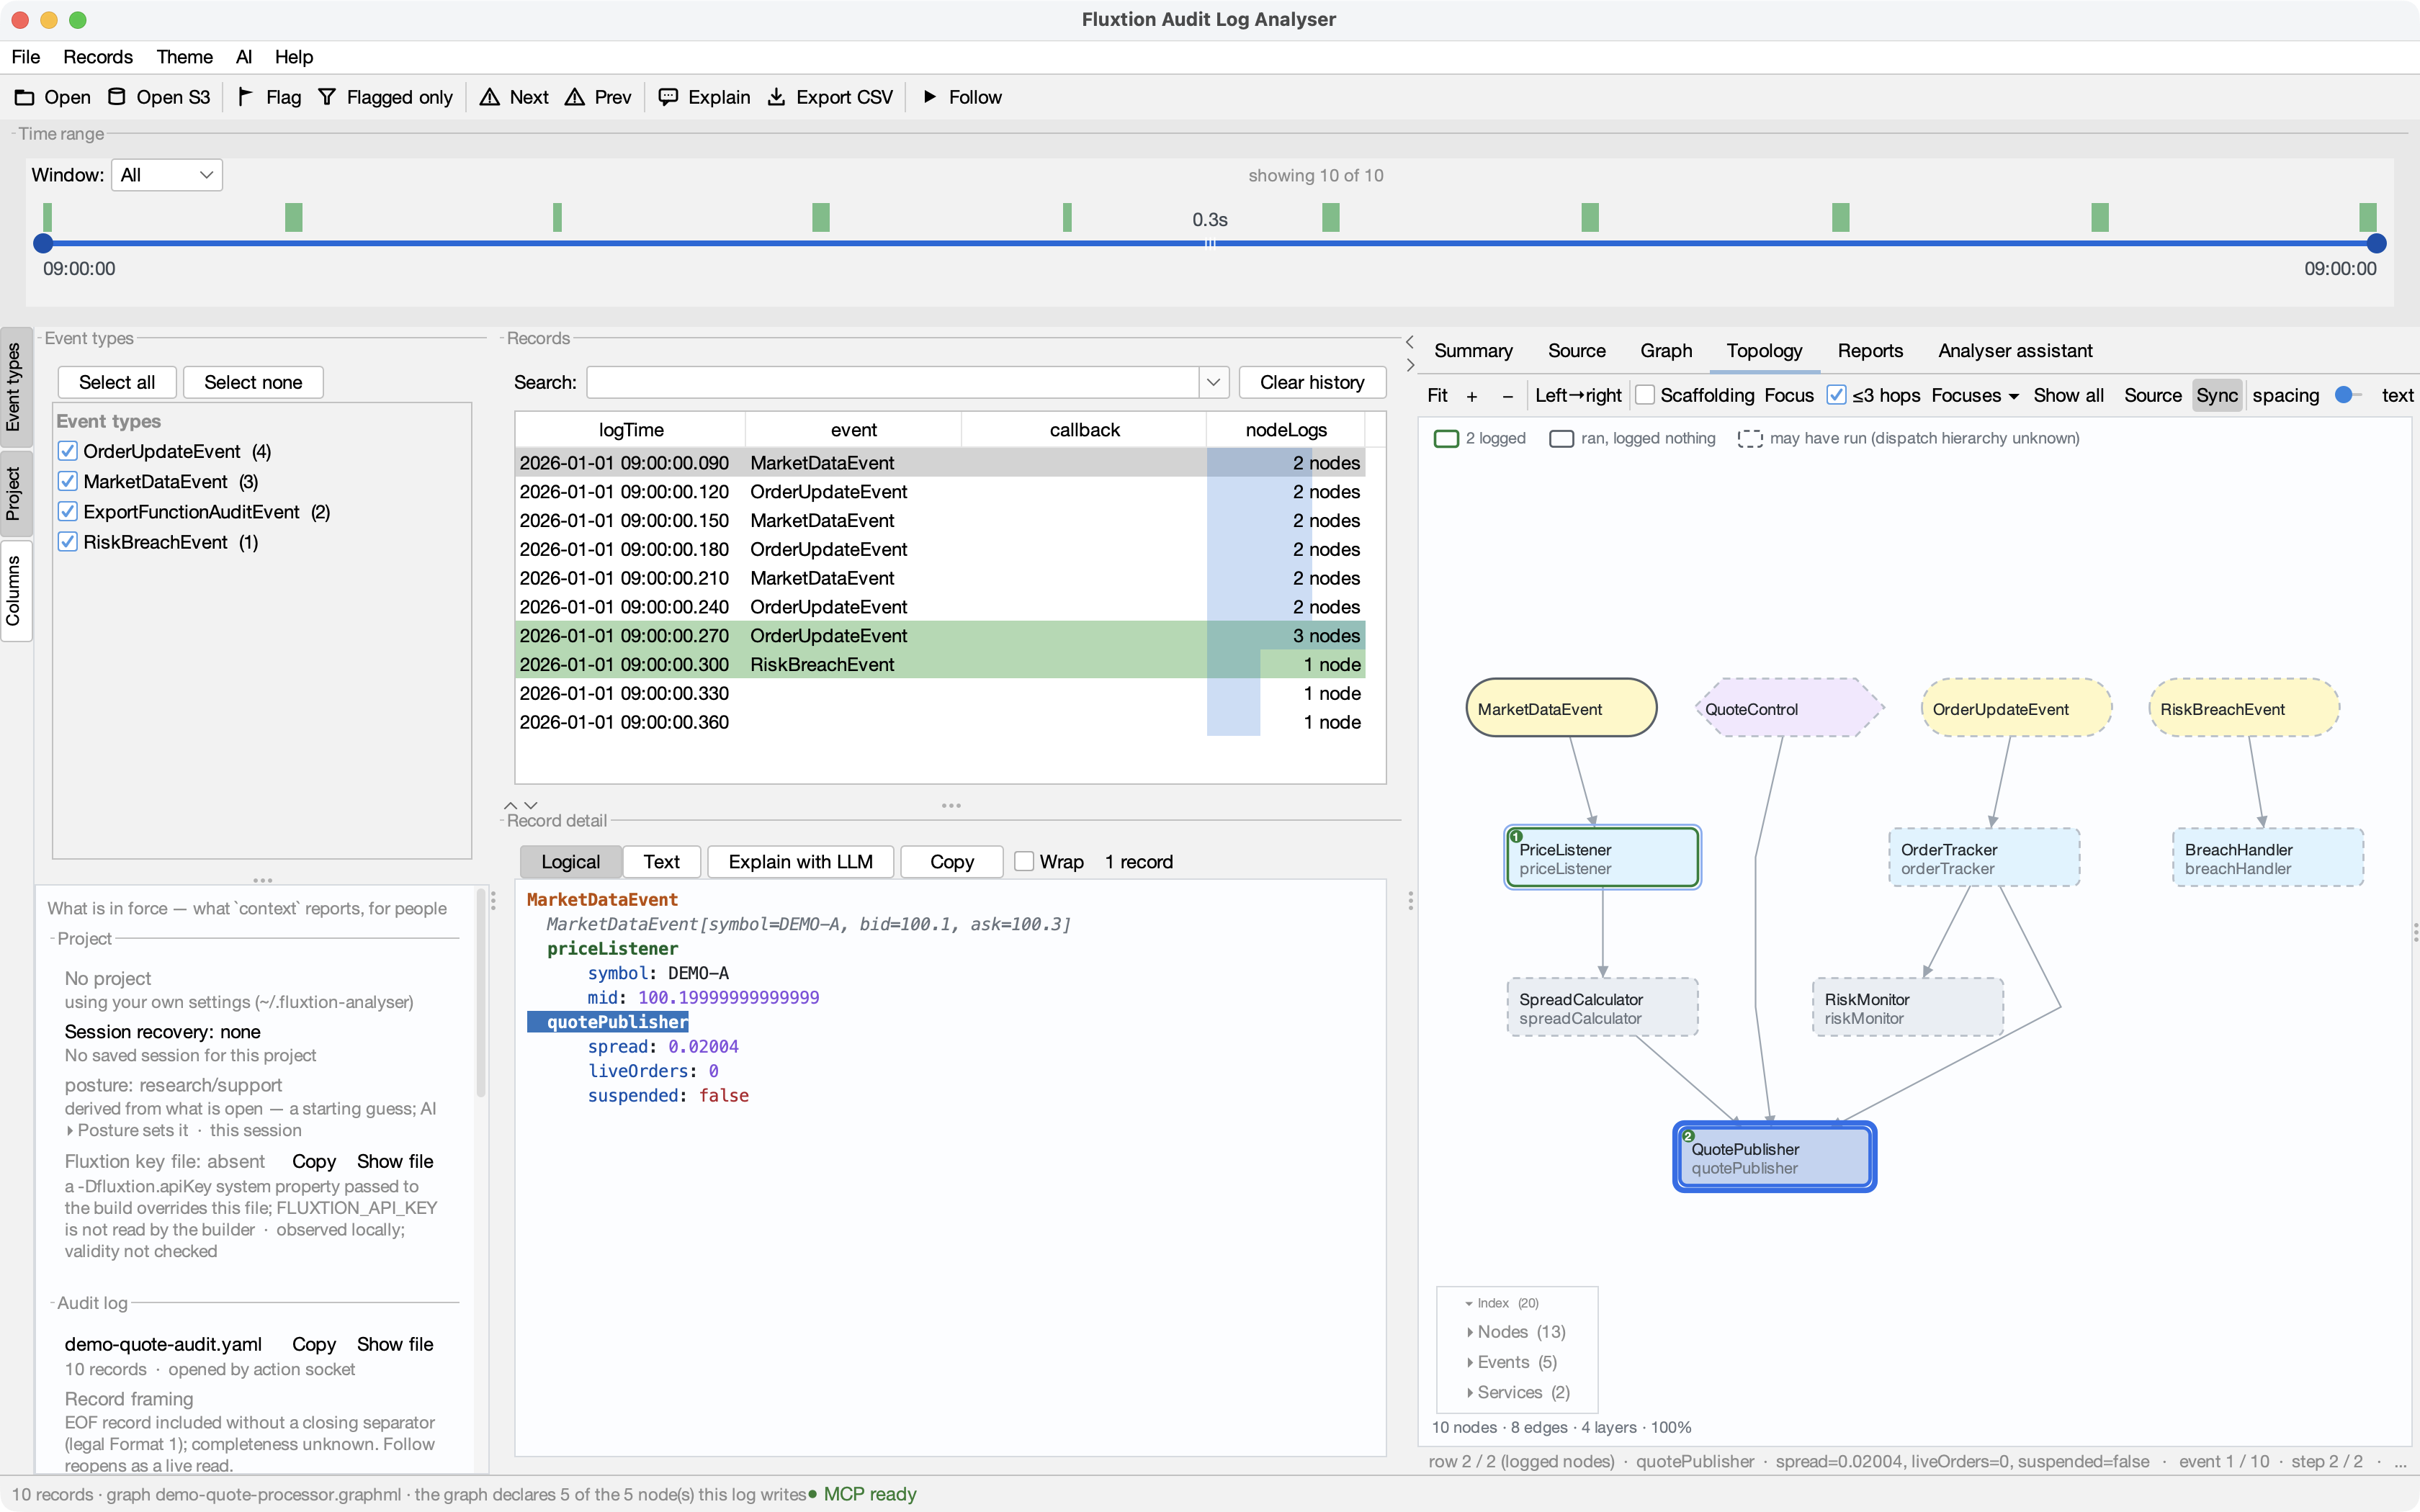
A MarketDataEvent arrived. Two nodes logged — priceListener ① and quotePublisher ② — and the
rest of the graph is shaded by what the log actually supports, which is not the same as what ran.
Look at spreadCalculator, sitting between them with a dashed outline. It certainly executed: the
spread it computes is in quotePublisher's log line. It simply writes no audit output of its own, so the
log never mentions it. The silent order-handling branch remains unknown: this graph does not declare whether another route enters through a supertype.
No audit entry does not mean the node didn't run
A node appears in nodeLogs only if it writes audit output, and only at the audit level in
force. Plenty of nodes execute silently. So the tab never colours a node "didn't run" — it shows
three claims on an ordinary, untraced record, and says which is which:
| On screen | What it means |
|---|---|
| green ring + number | logged — it wrote audit output, and the number is its dispatch position. The only thing directly observed. |
| solid outline | ran, logged nothing — it is the only way into something that ran, so dispatch had no other route. Certain. |
| dashed outline | may have run — the log does not say whether it ran. Missing supertype routes cannot rule it out. |
The distinction between the solid and dashed outlines matters: a node with several parents only needs one of them to have fired, so its other ancestors are unknowns, not certainties. Hover any node and it tells you in words.
"Ran, logged nothing" is only claimed when the log says how the cycle started. A record that isn't event dispatch at all — a startup callback, say — makes no such claim, because nothing upstream ran to cause it.
Turn the guesswork off: build with node-invocation tracing
If the processor is built with an audit level — cfg.addEventAudit(LogLevel.TRACE) — Fluxtion
emits an auditInvocation(...) call before every node it invokes, so every node that runs logs a
method entry whether or not it makes auditLog calls of its own. The runtime level then gates
whether those fire, so you can raise it on a live processor to get the detail.
The analyser detects such a record and stops hedging: the log is now a complete list of what ran, so a node's absence is proof it did not run, and the legend changes to say exactly that. All the "may have run" shading above exists because most production logs aren't traced — not because the distinction is unknowable.
Open a topology
Fluxtion emits a .graphml for the processor when it builds — typically beside the generated processor
source in your build output. Three ways in:
- File ▸ Open GraphML…
- File ▸ Open recent GraphML — kept separately from recent logs, so you're not scrolling past logs to find a graph
- drag the
.graphmlonto the window — it routes to the Topology tab by extension, and dropping a log and a graphml together opens both: the cycle and the graph it ran on, in one gesture - File ▸ Find GraphML in source roots… — when you don't know where the build put it. Every
.graphmlunder your configured source roots is listed, ranked by how well each fits the open log: node count, and how many of the log's nodes that graph declares. Nothing opens until you pick one — a graph chosen for you is a graph nobody checked.
Discovery also compares copies sharing a filename or a declared processor class. It lists each file's full path, total and authored node counts, source fingerprint, modification time, and fit against the log, including logged ids missing from the graph. Different fingerprints or node sets produce a disagree warning even with no log open; missing fingerprint metadata leaves agreement unknown. The analyser does not choose which build is correct.
Opening a graph starts a bounded background comparison in the configured source roots and its own
directory. The Topology status line says when copies disagree; context.graphPairing.copyComparison
provides the details. The open echo reports the check as pending, not as a completed comparison.
No warning blocks the chosen graph. Files outside those roots have not been compared, and truncated
or failed scans are reported. Reopen or use discovery to check again after a build changes the files.
Whatever was open when you quit is reopened next time, alongside the log — as are the zoom, pan, orientation, spacing and label size. (Settings ▸ History ▸ Reset topology view puts those back.)
You don't need a server for any of this. The graph is a file, the log is a file, and the analyser works on both offline — which is the point when you're supporting a system whose logs were shipped somewhere else days ago.
Does this graph belong to this log?
Pairing compares logged instance ids with every node declared in the graph, including framework nodes such as sink publishers. Hiding scaffolding changes the view, not this comparison.
A topology from a different build renders perfectly and misleads silently — the shading, the step order and the coverage figures are all derived from it. So the analyser checks, and says so where you can see it:
- the Topology status line always carries the verdict —
fits this log (211/211), or⚠ DOES NOT FIT THIS LOG — the graph declares only 0 of the 211 node(s) this log writes. It stays put; it is not a message that scrolls away on your next filter change. - opening a log closes a graph that no longer fits. That graph belonged to the previous investigation and nobody asked for it here, so it goes, and the status line says why.
- opening a graph keeps it even when it doesn't fit — you asked for that processor, and comparing one build's graph against another build's log is a real thing to want. You get the warning, not a refusal.
Treat the warning as a version mismatch, not a curiosity: the picture is wrong in ways you can't see from the picture.
Close and switch
- File ▸ Close graph drops the topology and leaves the log alone.
- File ▸ Close log does the reverse — records, filters, flags and shading go; your named graphs, focuses and reports stay, because those are yours, not the log's.
- File ▸ Reset does both.
- Opening a different processor's
.graphmlswitches straight to it. A multi-processor server emits one graph each, and analysing the second one against the same log doesn't mean starting over.
Switching or closing a project closes the log and graph too — a profile owns your source roots, processors, graphs and focuses, so it is the boundary of an investigation rather than a setting inside one.
Read the graph
Every edge points from a node to something it feeds, and layers respect that: a node always sits below everything that feeds it. So for any two connected nodes, lower means later.
Two nodes on the same layer are simply unrelated — the layout says nothing about which of them the processor dispatched first. When you need the true order, that's what the numbers give you: they come from the log, not the layout.
Fill colour distinguishes what a node is. Note that execution enters the graph two ways, and both appear at the top with nothing above them:
| Events | event classes arriving at the processor |
| Event handlers | the nodes that take them |
| Exported services | a service interface the processor exports. An entry point, not an output: an external caller invokes the interface and dispatch flows from there, exactly like an event |
| Nodes | ordinary compute nodes |
Output goes the other way and isn't a node kind: a node publishes to a sink, a Mongoose-supplied
service the graph registers with. You'll see that registration in the graph as a SinkRegistration event
feeding the publishing node.
Drag to pan, scroll to zoom (the point under the cursor stays put), Fit to frame the whole graph. Labels fade out when boxes get too small to read them, so a big graph zoomed out stays legible as shape rather than noise. Left→right flips the orientation if a wide graph suits your screen better. The spacing and text sliders adjust how much room the layout takes and how big the labels are — label size is independent of zoom, so labels stay readable when you zoom out to get your bearings.
Hovering a node tells you what it is, what the log claims about it in this cycle, and — when the class is under one of your source roots — the first line of its Javadoc.
Find your way round a big graph
A 300-node processor doesn't fit on a screen in a form anyone can read. Three things make it workable.
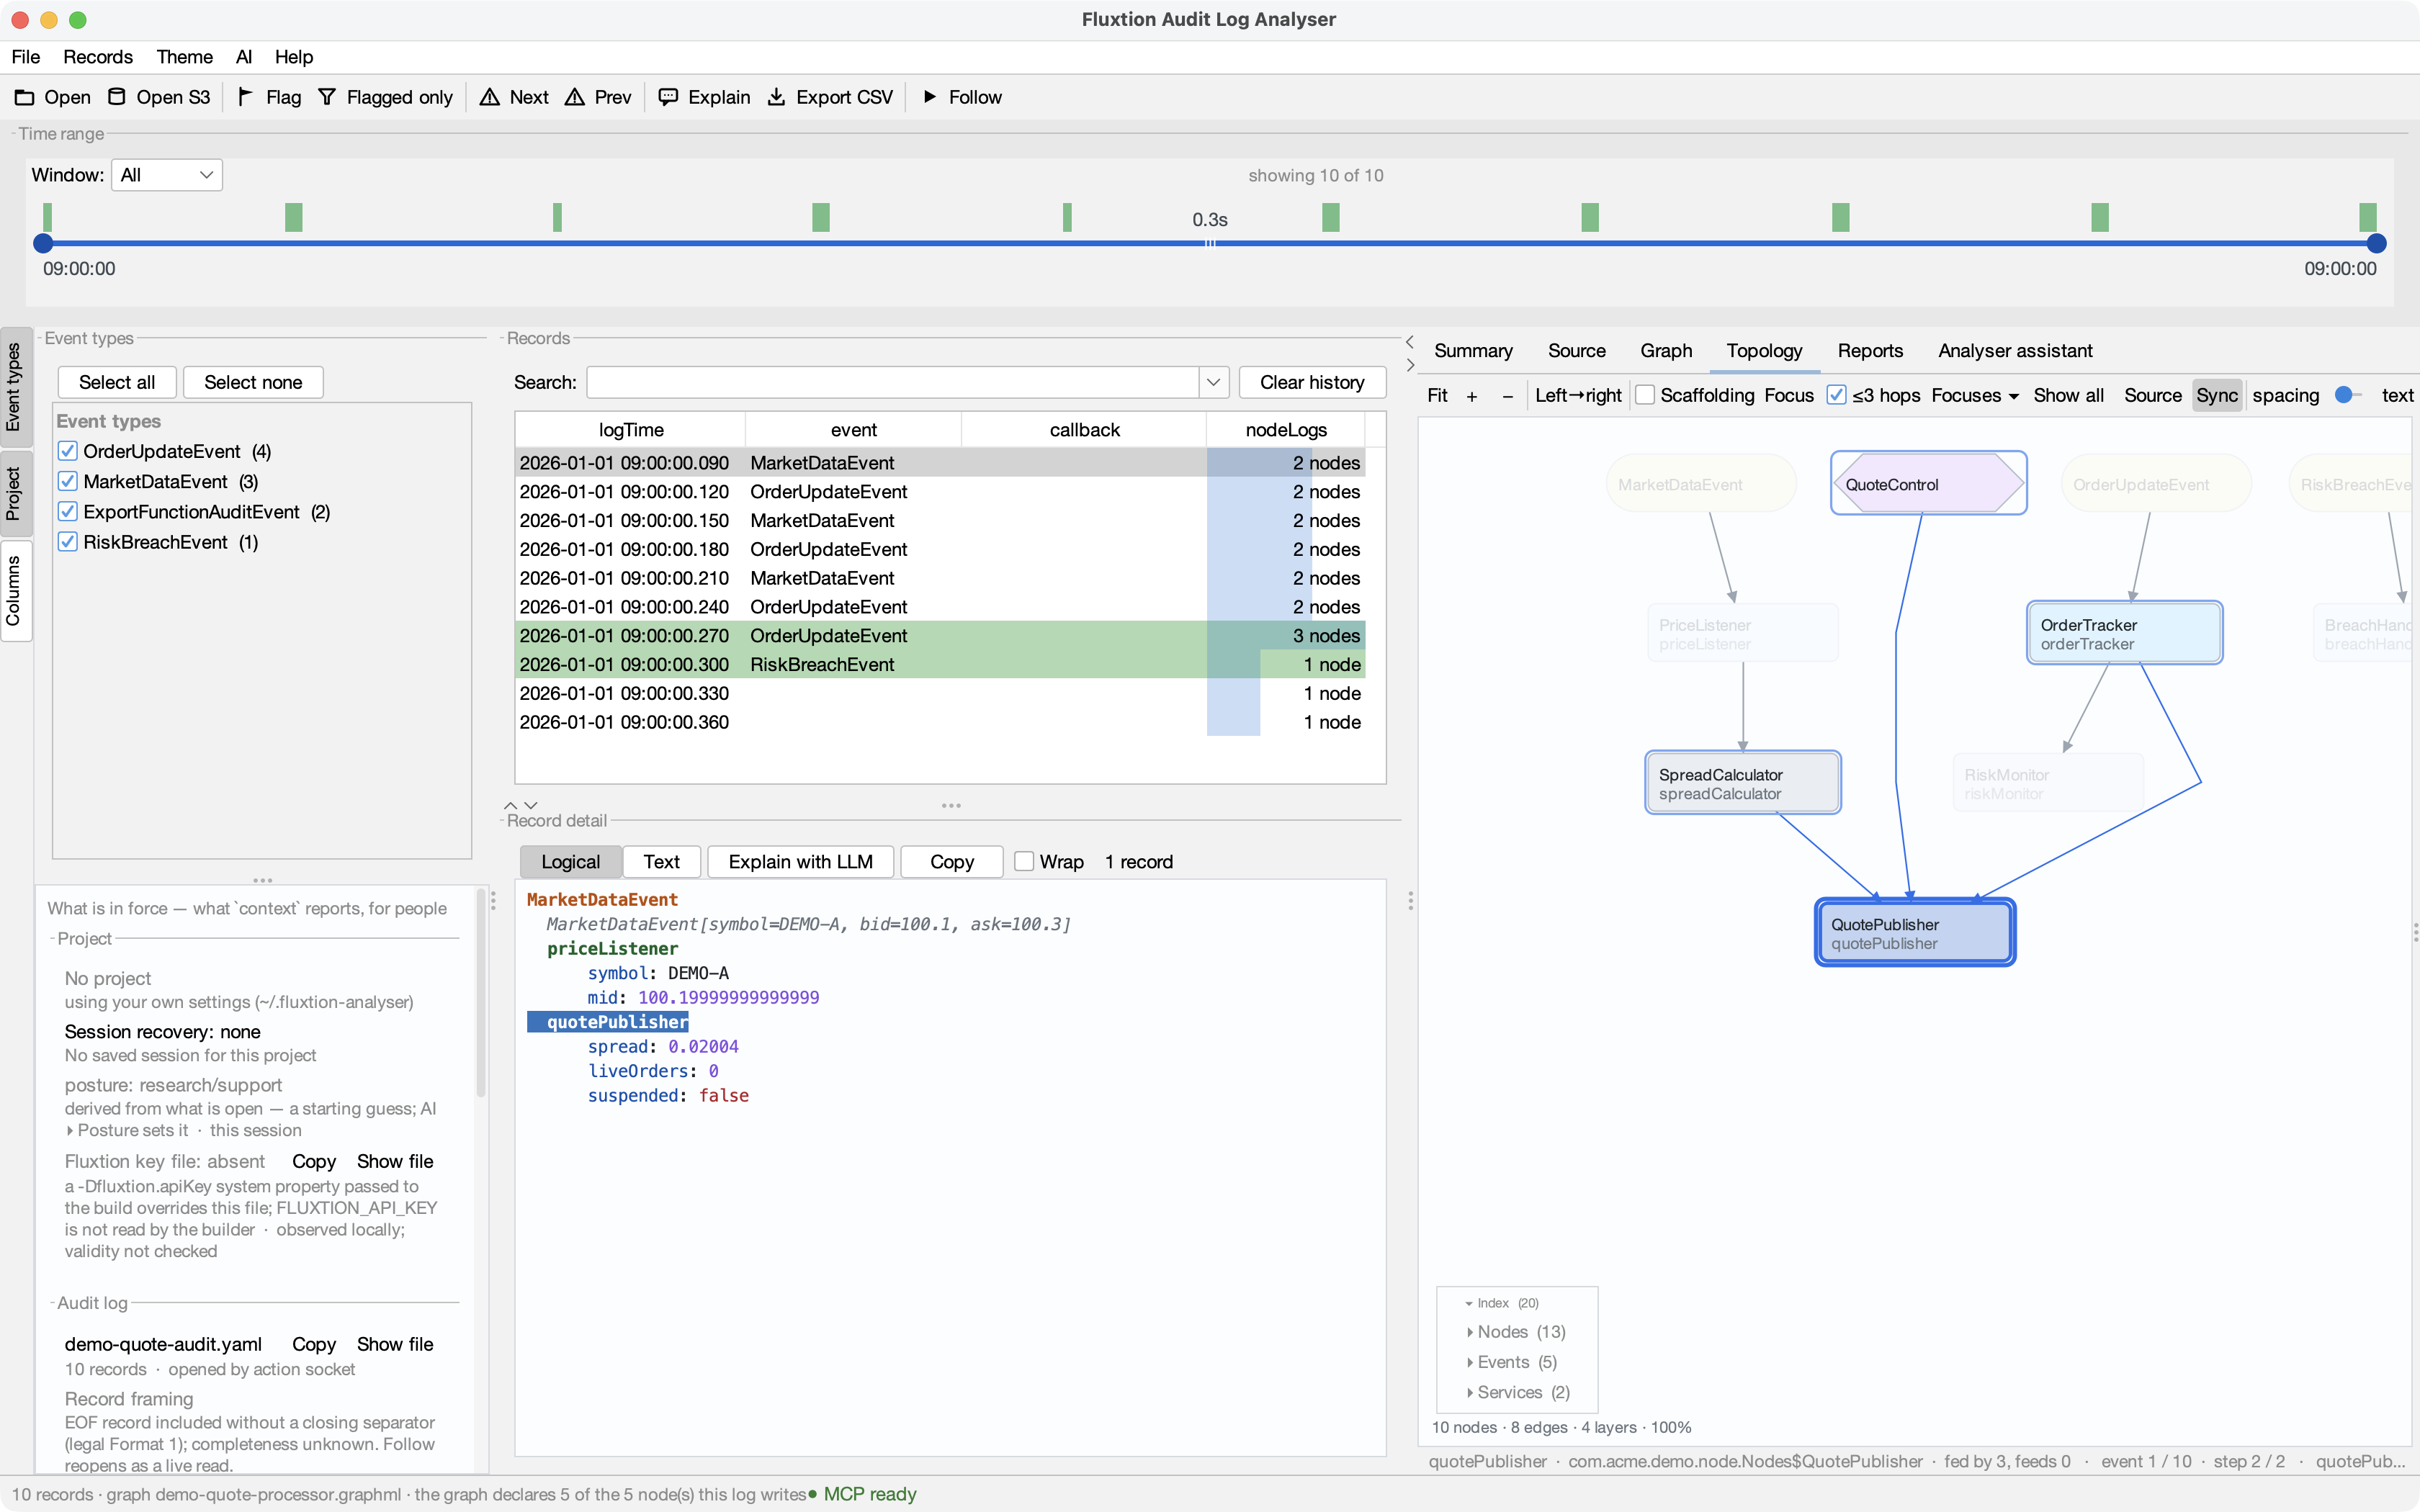
Hide the scaffolding. Fluxtion adds a dozen nodes to every graph it builds — the context, clock, dispatcher, audit and service plumbing. In the demo graph that's 10 of 20 nodes: half the picture, none of it yours. They're hidden by default; the Scaffolding checkbox shows them, and the status line always says how many are being kept back.
Click a node to scope it, click again to widen. Each click steps the scope out one level:
Neighbours is one hop each way; all routes is every ancestor and every descendant — what feeds it, and what it can affect. The status line names the current width and how many nodes it covers. Cmd/Ctrl-click (Cmd on macOS) adds nodes to the selection to build a wider scope.
Why 'all routes' from a sink stops at three hops
Point all routes at a node everything feeds — a publisher, a P&L aggregate — and the honest answer is most of the processor: every route into a sink is the graph. Focus works mid-graph and degenerates at its edges. So on a graph of 40 nodes or more, where all routes would cover more than half of it, the scope stops at 3 hops each way and the status line says exactly that, including how many nodes the unbounded answer would have been.
The ≤3 hops checkbox in the toolbar lifts the bound. Small graphs and mid-graph nodes are never bounded, so nothing changes for them.
The selection is ringed heavily, its scope ringed lightly, and everything else dimmed — dimmed, not hidden, because a node you can't see reads as a node that isn't there, and telling those two apart is this tab's whole job.
Focus is a filter — drill in, step out. Press F (or Focus) and the selection's scope becomes
the graph: everything else is gone, and the tab now treats this context as the whole world. Click a
node inside it and the scope cycle runs within the context; focus again and you drill a level deeper —
contexts nest. A breadcrumb on the toolbar shows where you are (All (62) ▸ hedge path (12) ▸ …, each
crumb clickable), Esc steps back out one level, and Show all returns to the full graph.
Two things stay honest inside a context. Clicking empty canvas clears the selection and dimming — it does not exit the filter (leaving is always explicit: Esc, a crumb, or Show all). And if the cycle you're stepping ran through nodes the context can't show, the status line says how many ran outside this view — a filtered picture never quietly pretends a propagation was contained.
Name a view worth keeping. Focuses ▾ saves the current context as a named focus — a name
plus a line saying why the view exists — and recalls it later from the same menu (or an agent can,
with topology {focus: "hedge path"}; agents can save them too, rationale included). Named focuses are
saved with your project and shared like saved graphs, so "the hedge path" can be a view your whole
team opens by name. Recalling one against a different build says how many of its nodes resolved instead
of silently showing a subset.
Pick nodes by name. The collapsible Index at the bottom-left lists everything in three groups — Nodes, Events and Services — built from the whole graph, so it's also how you reach something the filters are hiding. Clicking an entry selects that node and scrolls it into view; double-clicking opens its source.
Each group is sorted alphabetically, and numbers in a name are read as numbers: CHILL-2 comes
before CHILL-10, not after it. That matters exactly when the index does — on a graph built from
families of instances (chillers, tills, zones), where plain alphabetical order scatters a run of
twenty across the list and the emission order has no meaning at all.
Step through a cycle
Select any record and the topology shows that cycle. It follows the table's selection, so the record you're reading in the detail pane is the cycle you're looking at here.
Then walk it. ↓ steps forward, ↑ back (or use the ◀ ▶ buttons). ◀◀ ▶▶ skip a whole record when the rest of a cycle isn't interesting, and Play steps automatically to the end of the log:
One cursor, two depths. Arriving at a record is its own stop — the entry, where the graph marks how
the cycle got in (the event, or the exported-service call that was invoked). Step again and you move
through that record's nodeLogs rows one at a time; step past the last and you roll into the next
record's entry. Backwards works the same in reverse, landing on the previous record's last row.
As you go:
- the node under the cursor takes a strong halo, and rows already stepped in this cycle keep a fainter one, so you can see the path taken through the graph so far;
- the halo sits outside the node, so its execution shading stays readable underneath — where you are and what the log establishes are different questions;
- the status line names the position —
event 8 / 10 · step 2 / 5— plus the node and what it logged; - the detail viewer highlights the matching
nodeLogsline, so the graph and the text narrate each other; - only edges whose both ends ran are highlighted. An arrow from a node that didn't run would say the event arrived that way, and a highlighted arrow is an assertion.
Stepping moves through the filtered records, so narrowing the time range or the event types narrows what you walk.
What a row is depends on the audit level
The position readout says which, because the number matters:
row 3 / 8 (logged nodes)— an untraced record. The 8 rows are the nodes that logged, not the nodes that ran; silent nodes keep their "ran, logged nothing" or "may have run" shading while you step past them.invocation 3 / 16— a traced record. Every invocation is recorded, so stepping is exact.
A node that logs twice in one cycle gets two steps — it lights up again as current, and the detail viewer highlights the second line, not the first. That repeat is information, so it isn't collapsed.
Act on a node
Right-click any node:
- Open source — opens that node's class beside the graph, in a pane with a draggable divider, so you can read the code without losing the picture you navigated from. Enter on a selected node does the same, as does double-clicking an entry in the Index. (Repeated clicks on a node are reserved for the scope cycle, so a node's own double-click doesn't open source.) The Source button shows and hides the pane.
- Graph ▸ — plot one of the values this node logged. Only values that can be plotted are offered,
which follows the same rule as everywhere else: a number inside a
toString()is text, not a series (see Graphs ▸ Adding series). - Filter records to this node — narrows every view to records mentioning it, via the ordinary search box, so you can edit or clear it as usual. It's a free-text scan, so it's slow on a very large log.
- Copy instance id — for pasting into a prompt or a search.
Explain one cycle
A chart explains a trend. Most support work is the other question: this record is wrong — why?
Select the record, then Records ▸ Write a finding for this record…. Write what is wrong, and optionally where you think the cause is. The finding is then painted as a callout in the bottom-right of the graph whenever that record is on screen — the explanation in the ordinary text colour, the suggested fix in green, an amber bar down the left edge so it reads as commentary rather than as more log output.
It matters that this is drawn on the graph rather than beside it. This picture gets screenshotted into a ticket, and an explanation that lives only in the app is gone the moment the image leaves it.
There is exactly one place a finding is written — the record's flag — and three places it shows: the note column in the records table, this callout, and an exported report. That is deliberate. The same sentence maintained in two places is the same sentence right up until it isn't.
Use the Callout state (or topology {"callout": false}) to hide it without losing it.
Export a finding
Records ▸ Export finding to PDF… writes the whole diagnosis as one document:
- the explanation and the suggested fix,
- which record, when, which event, which log and which processor — and when the analysis was made,
- two views of the graph (below),
- the plot from the selected Graph tab, if one is open, marked with a dashed rule at this record,
- the full event record and node log, in monospace.
The two graph views answer different questions, and the second is the one people forget to ask:
- The cycle — only the nodes this event reached, and the order they logged in.
- Where it sits in the processor — the whole graph with that cycle lit. Unlogged nodes remain unknown on an ordinary audit record; only a complete invocation trace makes their absence conclusive. Missing graph edges do not establish that a check never fired.
Both are drawn for the page rather than screenshotted from the tab, so the document never inherits whatever zoom you happened to be at, and exporting never changes what you are looking at. Node logs paginate rather than truncate, and every page carries the record anchor — printed pages get separated from each other.
An agent can produce the same document without you: write the finding with flag, set the view up with
goto and topology, then call report. See Analyser assistant.
Where it fits
A Mongoose server with the admin web console can show you a live processor's graph. This tab is for the other situation, which is most of production support: many logs, archived, no server to ask — and here the graph is wired into the rest of the analyser, so a node reaches its source, its values and the records it appears in.
Missing dispatch hierarchy
Current GraphML files do not declare a complete event hierarchy. The Topology status and cycle legend therefore disclose dispatch hierarchy unknown. A named event entry and its drawn edges do not exclude a second route through a supertype. An unlogged node is not shaded as off-path on that basis. The topology context and coverage echo carry the same qualification; coverage report notes and exported cycle legends retain it. A complete invocation trace can still prove that a node did not run. The analyser does not infer missing inheritance or add edges.
The toolbar's Show all and topology {"showAll": true} perform the same operation: leave every
nested focus, clear selection and cycle shading, and return to the full graph. Combining the call
with scaffolding: false still exits focus while hiding framework nodes as a view choice.