Getting started
Two minutes to something worth looking at, and nothing to configure first. The analyser ships with a recorded run and its topology inside the jar, so you can see what the tool does before you have a log of your own.
Two minutes, no setup
- Run it —
jbang analyser@telaminai/fluxtionauditlog-analyser, or download the jar andjava -jar …. See Install & run. You need JDK 21+ and nothing else. - Click "Open the demo log" on the page the analyser opens on.
That is the whole path. No log to find, no source roots, no server, no API key. You get a real investigation — 10 events, the processor's graph, the cycle shaded onto it — opened through exactly the same door your own log will use.
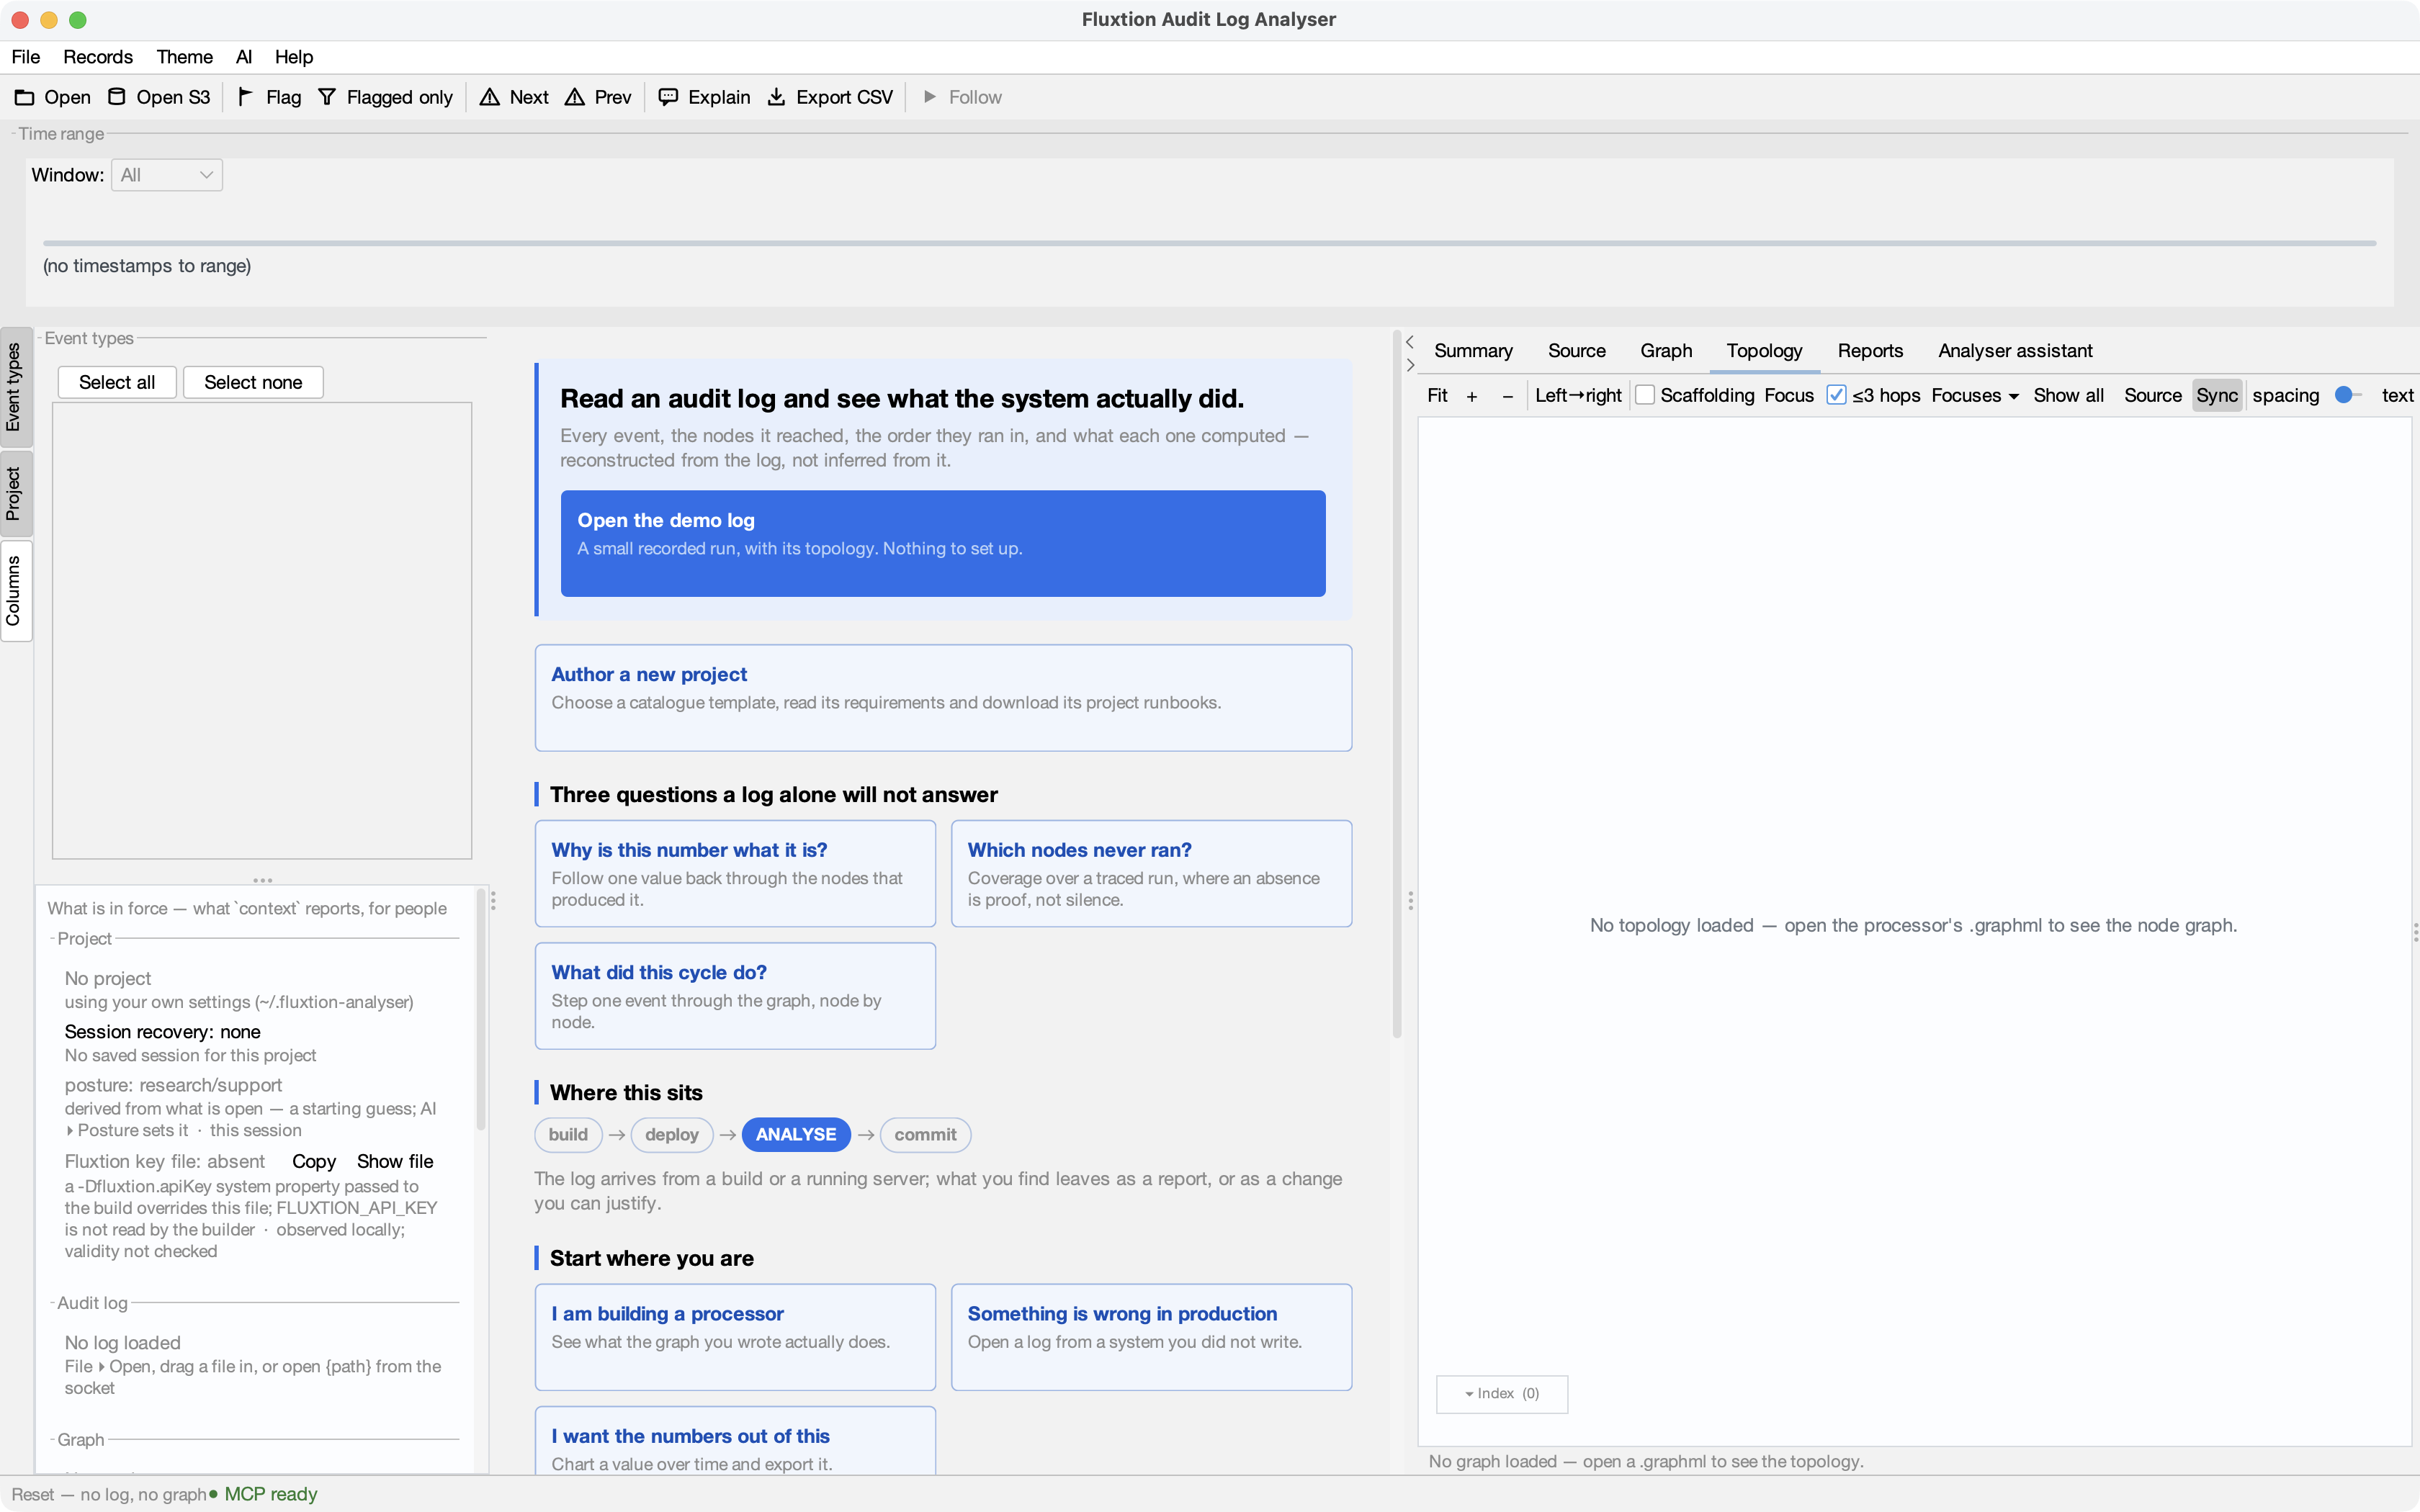
The page is a state, not a splash: opening a log replaces it, File ▸ Close log brings it back, and Help ▸ Start page recalls it without closing what you are working on. The three questions each open a different demo log, because one log cannot answer all three — coverage needs a traced run, and a chart needs a series.
Next: a system you actually run
The demo log is a recording. When you want to see the loop close — a running server producing a log that the analyser then explains — download a prepared project and run it: From playground to analyser in 10 minutes. It needs a JDK and no API key, and it is the same door your own system will use, one rung before you point the analyser at something of yours.
Then: your own log
When you have a log from your own processor — see Producing an audit log — open it with File ▸ Open log… or by dragging it onto the window. Everything below is optional and none of it blocks you from reading records:
- Source roots — File ▸ Settings… ▸ Source roots → Add the source folders for your processor and its node classes. This is what turns a log line into a click through to its code, and what grounds the assistant's explanations in real source.
- Your event processor — Settings ▸ Event processor → its fully-qualified class name, marked
active. The analyser uses it to map each
instanceIdin the log to a source file. - The topology — File ▸ Open GraphML…, or File ▸ Find GraphML in source roots… to see which of your compiled graphs actually fits the log you have open, ranked.
- An LLM key (optional) — Settings ▸ LLM for in-app explanations. No key? Skip it and use Copy prompt with any agent (see Assistant).
If you later regenerate a Fluxtion processor, that build uses a different key. Open
AI ▸ Fluxtion API key… (also offered on the Start page) to write the established
~/.fluxtion/fluxtion.apiKeyFile; named local profiles let one machine switch between, for example,
a work and evaluation key. The analyser reports presence only and does not validate or redisplay the
stored value. A -Dfluxtion.apiKey passed to the build overrides the file, while
FLUXTION_API_KEY is not read by the builder. Existing generated processors and the bundled demo run
without this key.
Now filter, graph, and explain.
Working with an AI? Connecting an LLM to the analyser is the third step — the agent drives this same window through MCP, and you review what it renders.
Opening logs
- Local file — File ▸ Open log…, drag a file onto the window, or pass a path as the first
command-line argument (
java -jar … my-log.yaml). - Recent — File ▸ Open Recent.
- Big files — files above the memory threshold are memory-mapped instead of loaded into heap, so multi-GB logs open fine (see Performance & S3 below).
From S3
File ▸ Open from S3… and give an s3://bucket/key URL. It streams the object using your local
aws CLI credentials (profiles / SSO) — no AWS SDK required. Set a non-default profile or region
under Settings ▸ Performance & S3.
Settings — everything to get running
Open File ▸ Settings…. The dialog is tabbed — Source roots, Maven repos, Event processor, LLM, Performance & S3, Assistant and History:
Source roots
The source folders for your processor and node classes. With these set, clicking a nodeLog line opens the exact class/method, and the assistant explains against real code. A root that can't be found shows red. See Source navigation.
Maven repos
Local Maven repositories (default ~/.m2/repository) are searched for *-sources.jar when a class isn't
under a source root — so third-party node sources resolve too. Tick Don't search local Maven
repositories to opt out.
Event processor
Add the fully-qualified class name(s) of your EventProcessor(s) and mark one active. Its node-field
declarations are how the analyser turns an instanceId into a source file, and how a selected record
scrolls the Source view to the handler that ran.
LLM (embed your own model)
Configure in-app explanations:
- Provider —
anthropic(Claude) oropenai. - Model — the model id.
- API key — stored locally in cleartext (a single-user desktop tool). It never leaves your machine and is never included in an exported settings file.
- Base URL (optional) — point at a proxy or compatible endpoint.
No key is fine
Leave the key blank and the assistant runs in copy-prompt mode — it builds a ready-to-paste prompt (evidence + the analyser's action protocol) for Claude Code, Claude Desktop or any agent.
This LLM-provider key is not the Fluxtion build key managed under AI ▸ Fluxtion API key…. They have different homes and purposes.
Performance & S3
- Memory threshold (MB) — logs at/below it load into heap; larger ones are memory-mapped
(
0= always memory-map). Applies to the next file opened. - AWS profile / region (optional) — used by Open from S3.
Assistant
Bounds for the two-way action loop: max action rounds and max actions per reply, and whether the in-process executor and the optional localhost REST transport (off by default) are enabled.
History
Clear remembered searches, saved graphs and recent files.
Themes
Switch Light / Dark / IntelliJ / Darcula any time from the Theme menu — the tables, source and charts recolour to match.
Tailing a live log (Follow)
To watch a log as it grows, turn on Follow (the toolbar toggle or File ▸ Follow (tail)). It polls the open local, heap-loaded file, appends newly-completed records and auto-scrolls to the newest — preserving your flags, filters and selection. Open graphs re-extract as records arrive, and the view moves only to reveal a point that would otherwise be hidden: a chart showing the whole log grows with it, one at the live edge slides, one zoomed into the middle holds. (Follow isn't available for S3 or memory-mapped files.)
Where next
- Graphs — plot node values and formulas over time
- Assistant — explain records, and let the assistant drive the analyser
- Source navigation — jump from a log line to the code
- Sharing setups — export/import your whole configuration