Connecting an LLM to the analyser
The analyser is the shared research canvas of the build-with-AI loop: you ask in your own words, the AI investigates, and it renders what it finds in the analyser — filters, flags, charts, topology steps, a report — for you to review. This page is the plumbing that makes that possible: how an LLM client connects, and how to check the connection is really working before you rely on it.
How the connection works
flowchart LR
  C["Your MCP client<br/>(Claude Code, Claude Desktop, Codex…)"] -->|stdio| B["Local bridge<br/>resolved launcher + --mcp"]
  B -->|localhost REST<br/>url + token from ~/.fluxtion-analyser/rest-endpoint| A["The running analyser<br/>(your live session)"]
Three parts, and it matters which is which:
- The analyser you already have open — the desktop app, with the log you loaded, the graphs you opened and the flags you set. That is the session the AI works on.
- A localhost REST transport inside the app. Off by default. When it is on, the app listens on
127.0.0.1on an ephemeral port with a per-run token, and publishes both to~/.fluxtion-analyser/rest-endpoint(mode 600) so nothing has to be copied into a prompt. - The bridge. Your MCP client launches the exact local command shown by Connect an AI client
(an installed JBang launcher or an absolute Java-and-jar command, followed by
--mcp) and talks MCP to it over stdio. The bridge is headless; it reads the endpoint file and forwards each tool call to the running app. It does not start the app — the point is to drive your live session, not a fresh one with nothing in it.
The client sees one tool per verb, analyser_open, analyser_context, analyser_filter,
analyser_graph, analyser_topology, analyser_flag, analyser_report and so on — sixteen in all,
each with its parameter schema, so there is nothing to teach the model. The read-only ones are marked
read-only; the ones that write files or replace what is loaded are marked destructive so your client asks
you first. The full verb reference is in Analyser assistant.
For clarity, JBang installs the local executable as analyser. The in-app setup registers the
separate MCP client label fluxtion-analyser, whose command is the resolved
~/.jbang/bin/analyser --mcp (or the equivalent packaged-JAR command). Those names have different jobs;
the registration does not require an executable rename.
Connect, step by step
-
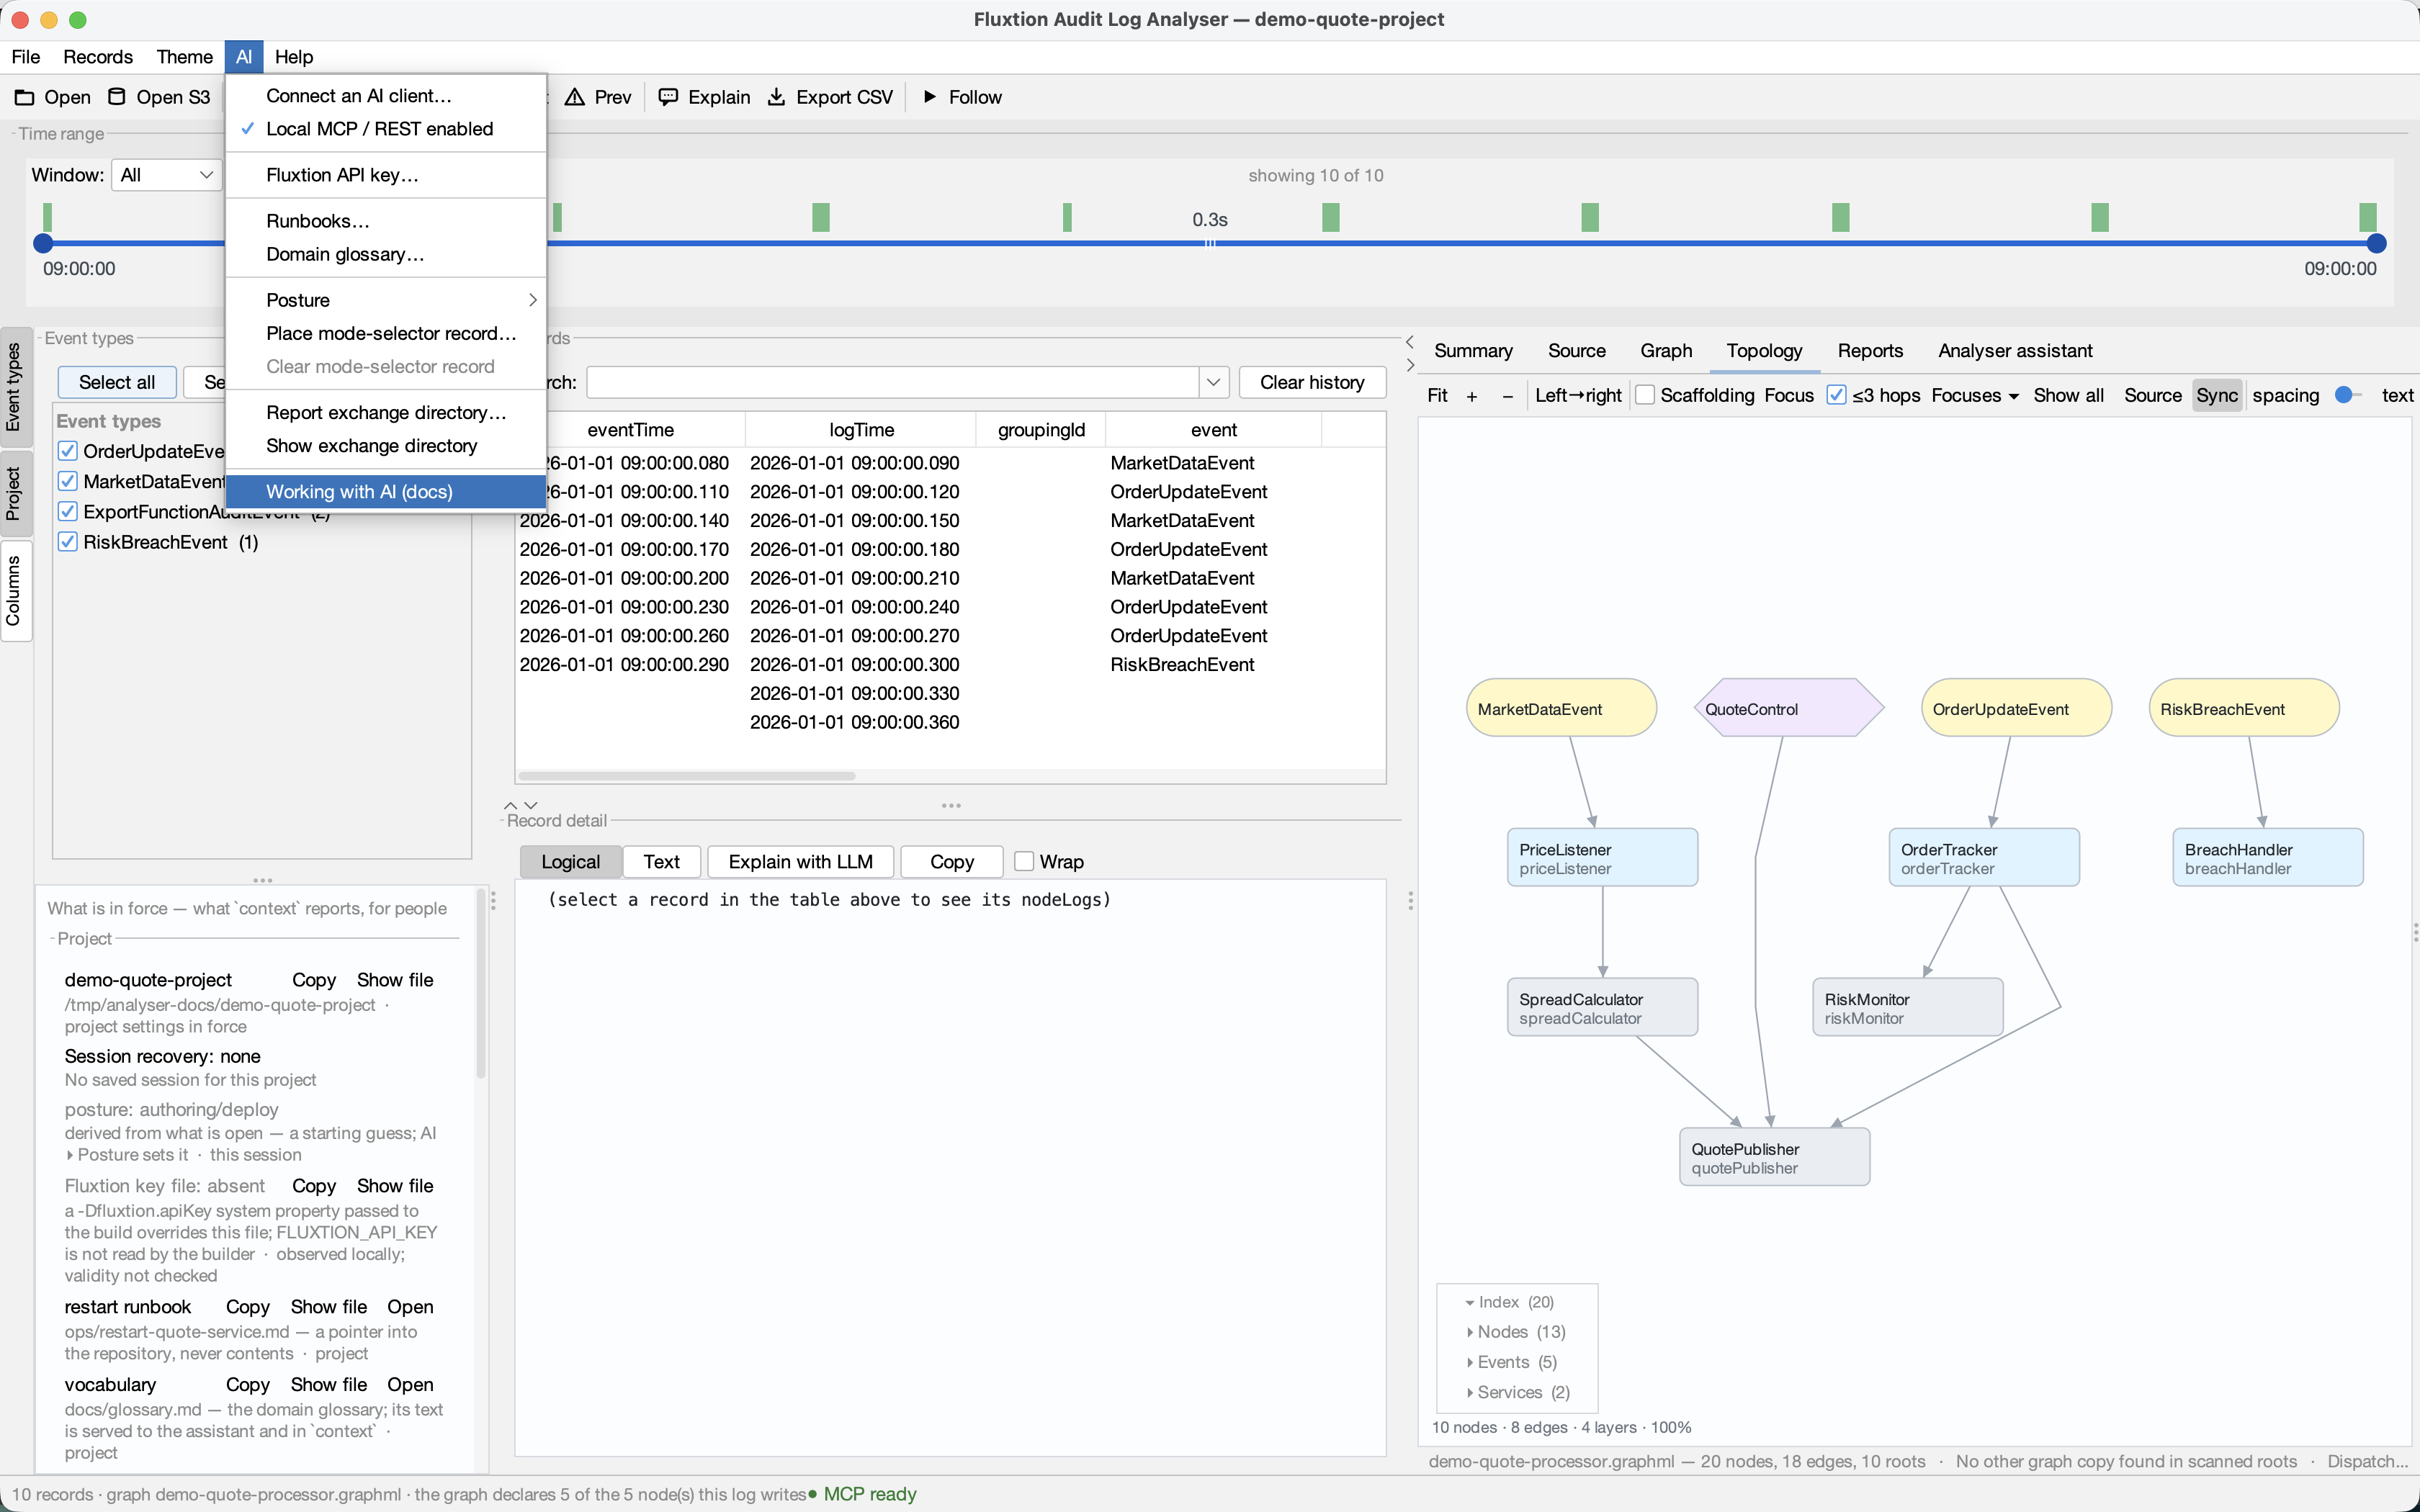
Start the analyser and turn the transport on. Tick AI ▸ Local MCP / REST enabled (it is remembered, and it is the same setting as Settings ▸ Assistant ▸ localhost REST transport), or start the app with the flag that does the same and says so on the console:
java -jar fluxtion-auditlog-analyser.jar --rest
# or: jbang analyser@telaminai/fluxtionauditlog-analyser --rest
The status bar reads Assistant REST transport listening on http://127.0.0.1:….
--restis also what an agent runs on a machine that has never seen the analyser: no dialog stands in its way, and the console names the endpoint file. Neither route puts the per-run token in client configuration.
-
Set up the bridge from the analyser. AI ▸ Connect an AI client… — reachable at any time, including with a log open, which is usually when the thought occurs. The same screen is on the Start page (Connect Codex, Connect Claude, Generic MCP setup) and at Settings ▸ Assistant / LLM. It shows the resolved, absolute bridge command for this installation rather than a command you have to reconstruct.
- Codex and Claude Code offer explicit, confirmed CLI registration. Claude Code's automatic route is user-scoped; its project command is deliberately copy-only, so run it yourself from the project root you mean to change.
- Claude Desktop has no bundled extension for this per-machine JBang/Java bridge. Select its Generic MCP setup fallback instead; the analyser does not edit Claude Desktop configuration.
- Generic MCP setup shows a complete
mcpServersJSON record. Copy it or save it to a file you choose, then put it in the location your client documents. The JSON preserves every command argument separately and never contains the endpoint or token.
Opening the setup screen changes nothing. Use Check connection after enabling local transport: it starts the exact bridge command and asks it only for
analyser_context. A green result proves the local analyser-to-bridge chain, not that a client has imported the registration. Restart or reload your client where that client requires it.
The registration screens
The Generic MCP choice shows a complete, selectable mcpServers record. Copy configuration copies
only that JSON; Save snippet… writes it only to a file you select and confirms before replacing one.
Neither action changes a client configuration. The path below is deliberately a neutral documentation
path — use the exact launcher shown by your analyser, not the one in this image.
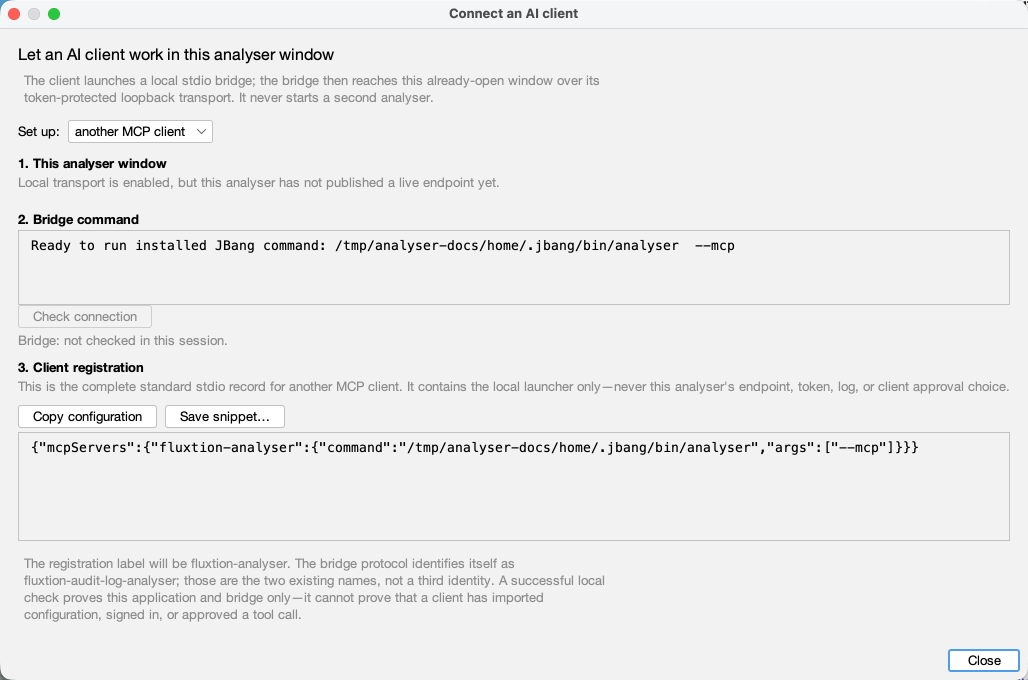
For Codex and Claude Code, choose Check … registration first. The app reports only the named
fluxtion-analyser entry; it does not infer that an entry at a different scope wins. Register or
Replace then shows the full command and a clear statement of what will change. It is still only a
proposal: Cancel does not start the client or write a configuration.
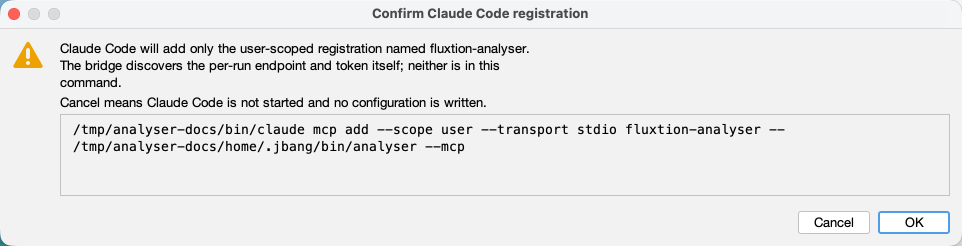
The Claude Code example is user-scoped. Codex uses the same readable confirmation layout for its shared local registration. A project-scope Claude Code command remains copy-only; run it from the project root yourself if that is the configuration you intend to change. A successful confirmation says that the client command completed—not that a client is currently signed in, connected, or approved to call a tool.
- Open a log in the analyser — or let the AI do it with
analyser_openonce you have checked the connection. Everything the AI renders lands in the window you are looking at.
Check it is working
Do these in order; each one isolates a different part of the chain.
Is this window even serving? Read the status bar first — it costs nothing:
| Light | Means |
|---|---|
| MCP ready | this window is serving; a client pointed here reaches this log |
| MCP elsewhere | another analyser window owns the endpoint — a client is reading that window's log, not this one |
| MCP starting | enabled, but no live endpoint published yet |
| MCP off | the transport is off — tick AI ▸ Local MCP / REST enabled |
If the window that owns the endpoint closes, a window whose transport is on takes the endpoint back within a few seconds and its light returns to MCP ready — a live owner is never displaced, so two windows cannot fight over it.
Ready is not connected: this window being reachable and a client actually talking to it are different facts, and only the second needs a probe. MCP elsewhere is the one that quietly wastes time — two analysers open, and the answers are about the other one.
Does the bridge reach this app? The quickest normal check is AI ▸ Connect an AI client… ▸ Check
connection. It runs the exact command shown on that screen and makes the read-only analyser_context
call. It is deliberately a bridge check, not an imitation of Codex, Claude Code or another client.
For a technical check, the endpoint file exists while the analyser is listening and names a URL:
cat ~/.fluxtion-analyser/rest-endpoint
# {"url":"http://127.0.0.1:52041","token":"…","pid":12684,"startedAt":"…"}
No file means the transport is off — tick AI ▸ Local MCP / REST enabled, or restart with --rest.
Does your client see the tools? In Claude Code, /mcp should show the server connected with
15 tools:
> /mcp
  ⎿ fluxtion-analyser   ✔ connected · 15 tools
       analyser_aggregate · analyser_read · analyser_series
       analyser_filter · analyser_graph · analyser_goto
       analyser_flag · analyser_report · analyser_coverage
       analyser_context · analyser_topology · analyser_screenshot
       analyser_open · analyser_source_root · analyser_source · analyser_spotlight
If the server is missing, the client did not launch the bridge. Reopen the analyser setup screen and use the exact resolved record or registration command; then restart/reload the client if it requires that.
Does a call reach the app? Ask for something harmless and read-only:
- A description of your session — the log, its record count, the filter, any flags — means the whole
chain works. Nothing changed on screen:
contextonly reads. - "analyser not running, or REST transport disabled — start the app with
--rest" means the tools are registered but the bridge found no endpoint file or could not reach it: the app is closed, or the transport is off. Fix step 1 and ask again — no client restart needed. - "no log loaded" means the chain works and the analyser is simply empty. Open a log, or ask the AI
to:
Open /path/to/audit.yaml in the analyser.
Does a render land on the canvas? Ask for one visible, reversible change:
The records table narrows and a flagged row appears — in your window, as you watch. Everything the AI
does from here is like that: a change you can see, click into and undo. If you would rather script the
same check without a model in the loop, tools/drive-analyser.sh context in the repository sends the
same call the bridge does.
If something is off
| Symptom | Cause | Fix |
|---|---|---|
| Tools listed, every call says not running | app closed, or REST transport off | start the app; AI ▸ Local MCP / REST enabled, or --rest |
| Server never appears in the client | stale launcher or client not reloaded | reopen AI ▸ Connect an AI client…, use its resolved registration/JSON, then restart or reload the client if required |
| Calls time out on a very large log | an aggregate over millions of records |
raise the client's tool timeout (Codex: tool_timeout_sec) |
screenshot / report refused |
file exchange is opt-in | Settings ▸ Assistant ▸ Allow assistant file exchange, and pick the directory |
The AI opened a log but context shows nothing yet |
opening is asynchronous | ask for context again — it reports the log, its time-order report and any offers once the load lands |
The same token-guarded, loopback-only transport also lets a plain script or another agent drive the
analyser without MCP at all — GET /manifest on the endpoint URL publishes every verb's schema. See
Analyser assistant for the action protocol and the FAQ for what the
socket can and cannot do to your machine.