User guide
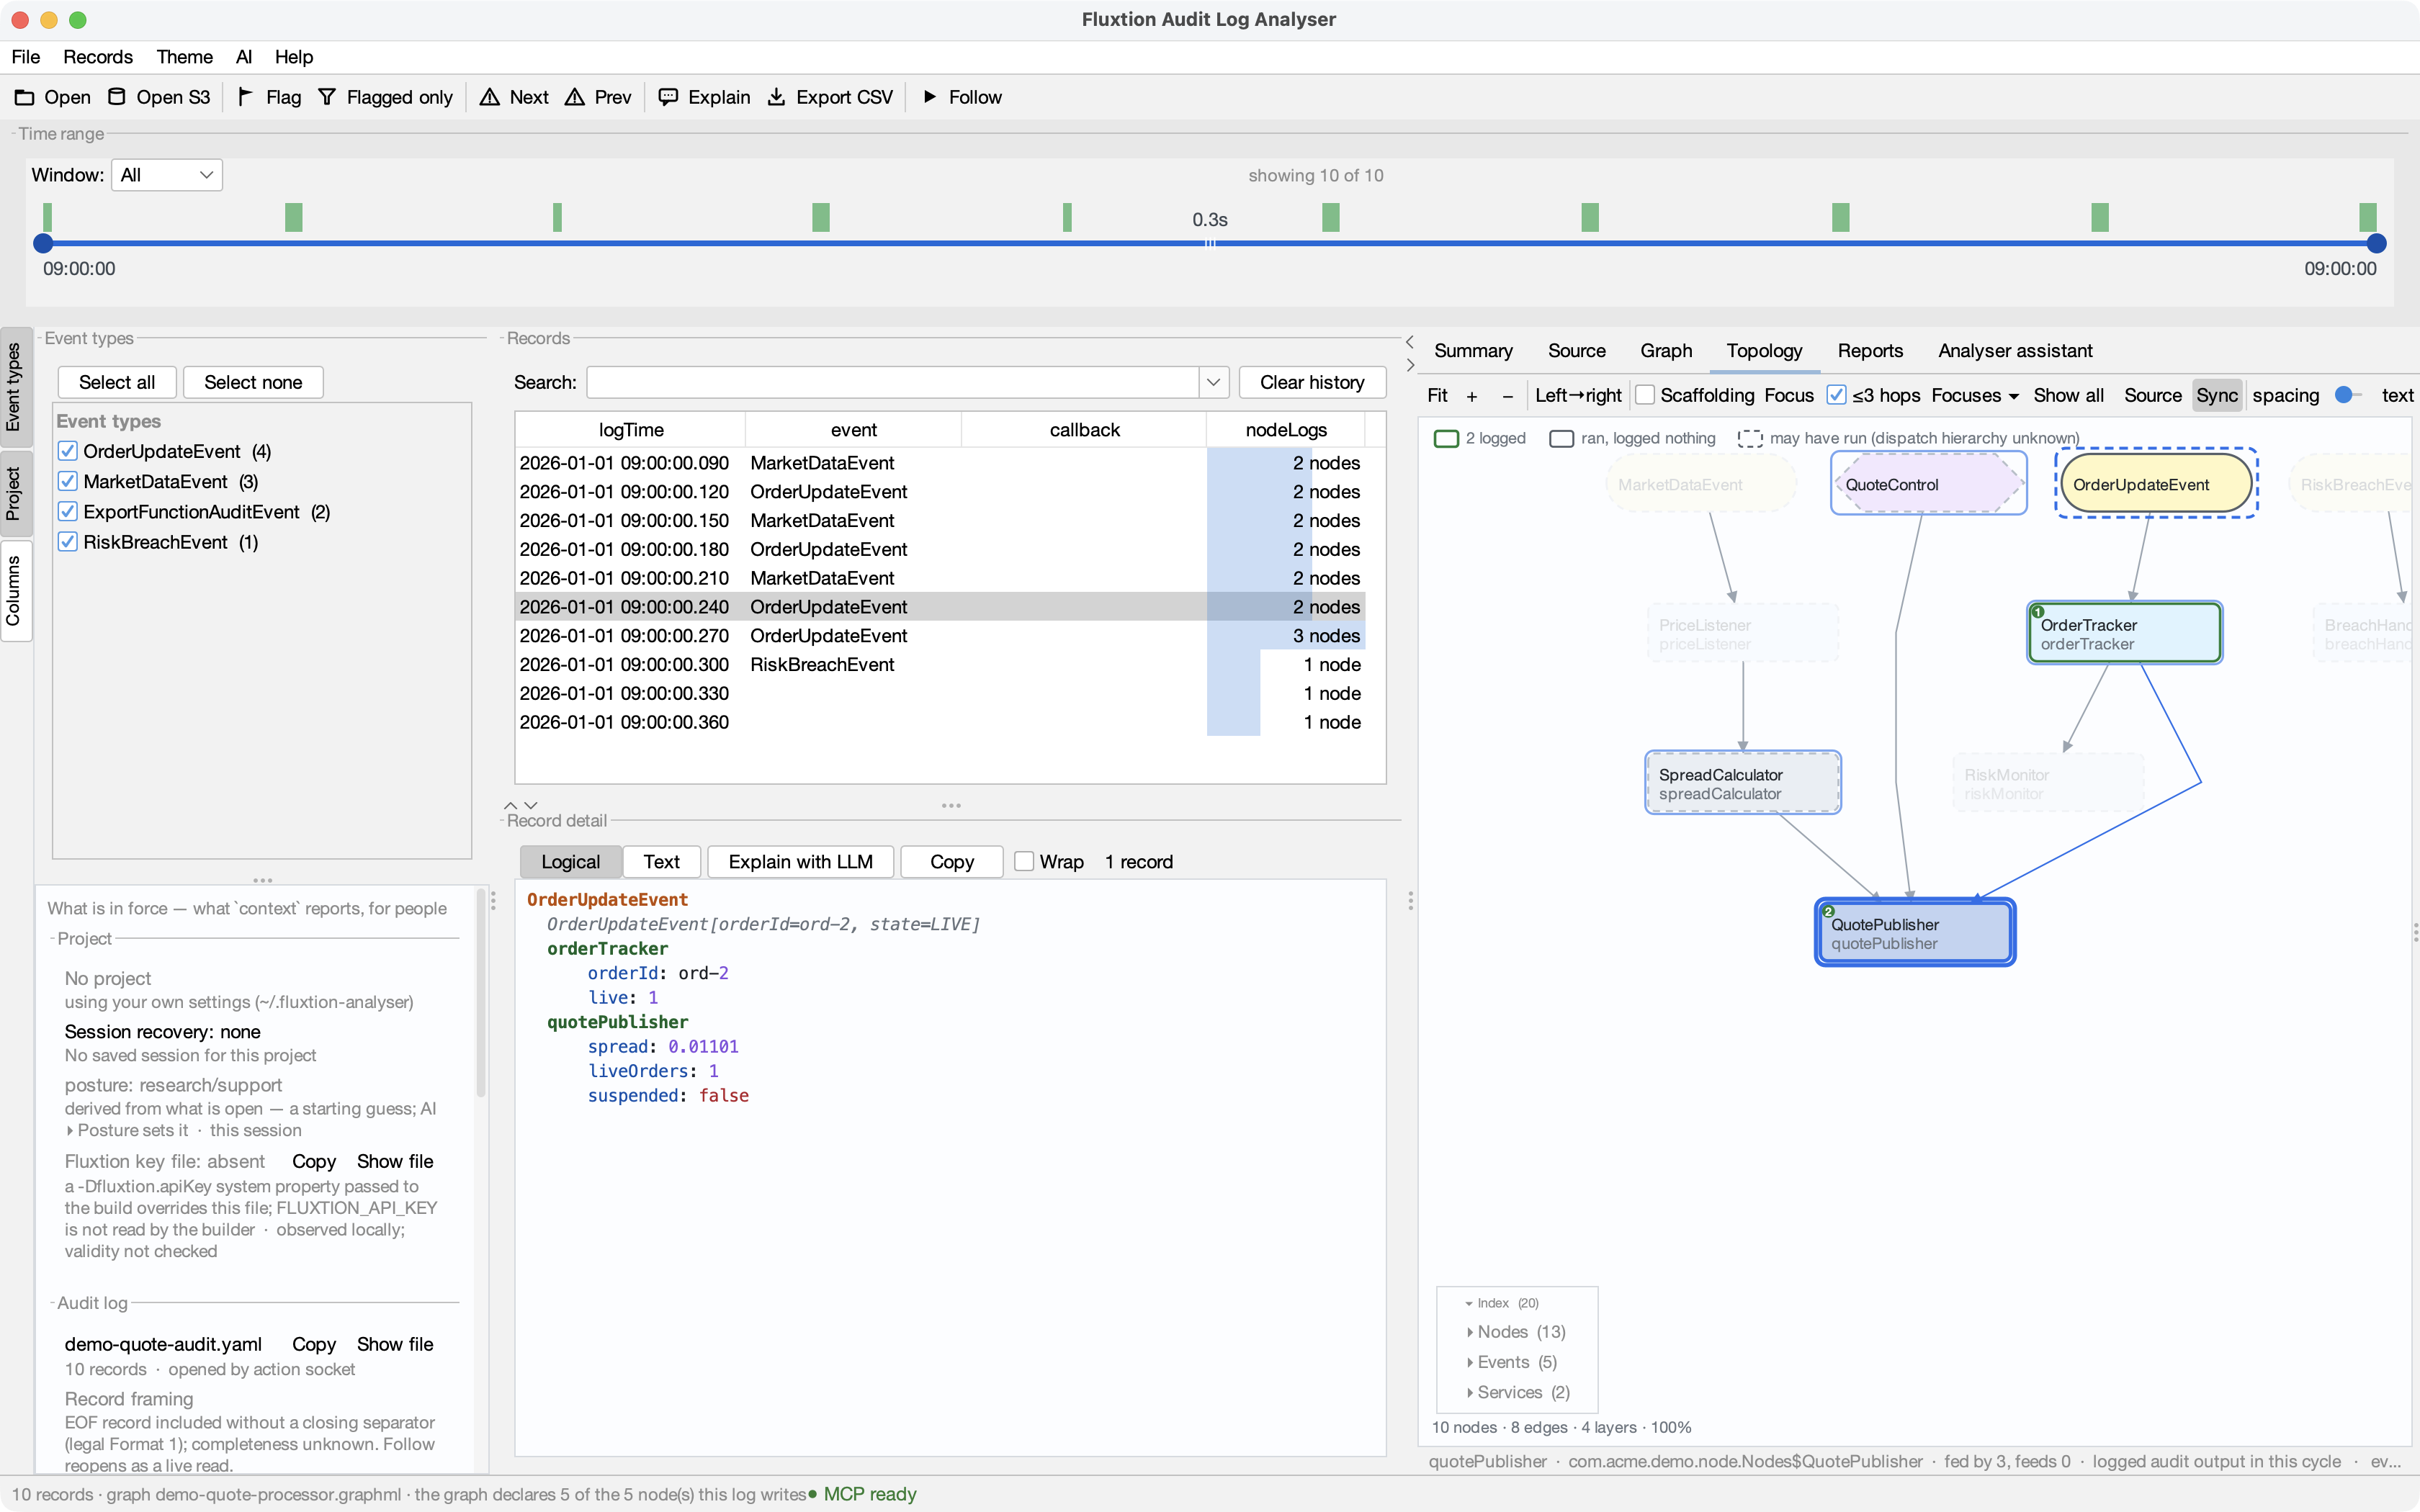
The Fluxtion event-audit log is the single source of truth — a deterministic, replayable trace of every propagation cycle. Everything in the analyser is a view over that one log: the records table, the record detail, search, the shared filter, the summary, graphs, and the assistant all read the same data. Narrow the view and every surface follows; nothing is a separate copy that can drift.
New here? Start with Getting started.
Answering a question about a running system?
If you were handed a log and a question about an incident you were not there for, start with Answering questions about a running system — the same surfaces below, ordered by the question instead of by the feature. It lives under Working with AI because that is how most teams drive it, but none of it requires an assistant.
In this section
- Records, detail & filtering — the core lenses: the records table, the detail viewer, search, the shared filter, summary and diff.
- Graphs — plot node values and formulas over time.
- Topology & step-through — the processor's node graph, and which nodes fired in a cycle.
- Assistant — explain records, and let the assistant drive the analyser.
- Source navigation — jump from a log line to the code.
- Sharing setups — export/import your whole configuration.
- The Project panel — what is in force: project, log, graph, processors, roots — in one place.
- Portable context — the project as a shared workspace: three tiers, and why a runbook is only ever a pointer.
Not sure where to begin? Getting started walks you from a fresh install to a graphed, explained log.