Investigation reports
Every surface in this tool produces evidence. A report produces the account of it: "across these records, these nodes and this window, here is what happened and why" — kept, re-checkable, and shareable, instead of living in a chat window that scrolls away.
References, never a document
A report is an ordered list of references with connective prose — never a free-form document.
A finding flagged as kind: "confirmation" uses Observation / Assessment, including in exported
PDFs. Existing fault findings retain their labels. Choose the category when writing the flag; the report
uses that same finding.
Sections are typed: a finding points at a flagged record, a record at a cycle, a chart at a
named graph, a topology at a named focus, a table at the query that derives its rows, and only
narrative stores its own content. That one constraint keeps this a forensic instrument: a report
assembles what other verbs produced, and every claim traces to something that can be checked.
Two rules follow, and both are enforced rather than encouraged:
- A report includes findings; it never authors them. A finding section renders what
flagwrote, byte-identical — the report verb has nowhere to put its own version of the diagnosis, so one record can never carry two accounts of itself. - Narrative is visibly narrative. Prose renders with its own colour and a standing label — "the author's account, not log evidence" — on screen and in the PDF alike, so an assertion can never pass as a record.
Evidence re-renders live
A report stores references, so opening it re-reads the records, re-extracts the charts and re-runs the queries against the loaded log. A reference that no longer resolves is reported — "2 of 5 anchors did not resolve against this log" — never silently dropped or silently stale. That also makes a report a re-runnable claim: open last month's investigation against today's log and find out whether it still holds.
Because the dangerous failure arrives resolved rather than dangling (record #42 exists in any log with 43 records), a report also captures its authoring context: a fingerprint of the log it was written against (name, record count, time range — and, where the log's provenance came from a project environment rather than a declaration, matched by directory, not declared) and the filter it was written under. Opening it against a different log names the mismatch before any section renders — announced, never refused, because comparing a finding against a later run is legitimate and valuable. Opening it under a different filter offers the stored view; declining renders under the current filter and says so on the page.
Tables: derived rows, declared presentation
A table section stores the query that produces its rows plus a column spec — headings, order,
widths, alignment, number formats (0.00, percent, duration, time). Rows re-run with the log;
the presentation persists. Numbers set right-aligned in tabular figures. A table can cite the same
verbs an agent sees over MCP:
read {fields, recordIndex…}— the selected records;aggregate {metric, groupBy, filter, limit}— count/rate buckets;series {expr, buckets}— buckets,series {expr, crossings}— anchored crossing rows, or plainseries {expr}— one statistics row;coverage {filtered}— the full graph-ordered ledger: covered, uncovered, and deliberately excluded nodes with their reasons.
Each source prints its own scalar context under the table — population and scope for an aggregate,
points and thresholds for a series, or the complete coverage denominator — and the same line appears
in the PDF. A zero-result call keeps its header and says why it has no rows. Structured call values
such as filter: {from, to, dimensions} are saved and reissued as data, rather than becoming display
text after a restart.
A row highlight is a rule, not a paint: rowWhen: "book.mid > 17" re-evaluates with the data,
strictly against each row's own record — a value the record didn't log cannot fire the rule —
and the rule is printed with the table, because an unexplained red row would be a judgement
wearing evidence styling. That makes it valid for read and series-crossing rows (which link back to
a record), but not aggregate buckets, series buckets/statistics, or coverage rows; those refuse the
rule with a visible warning rather than quietly applying a different column formula. Tables export to
CSV (raw values — formatting stays on the page).
The Reports tab
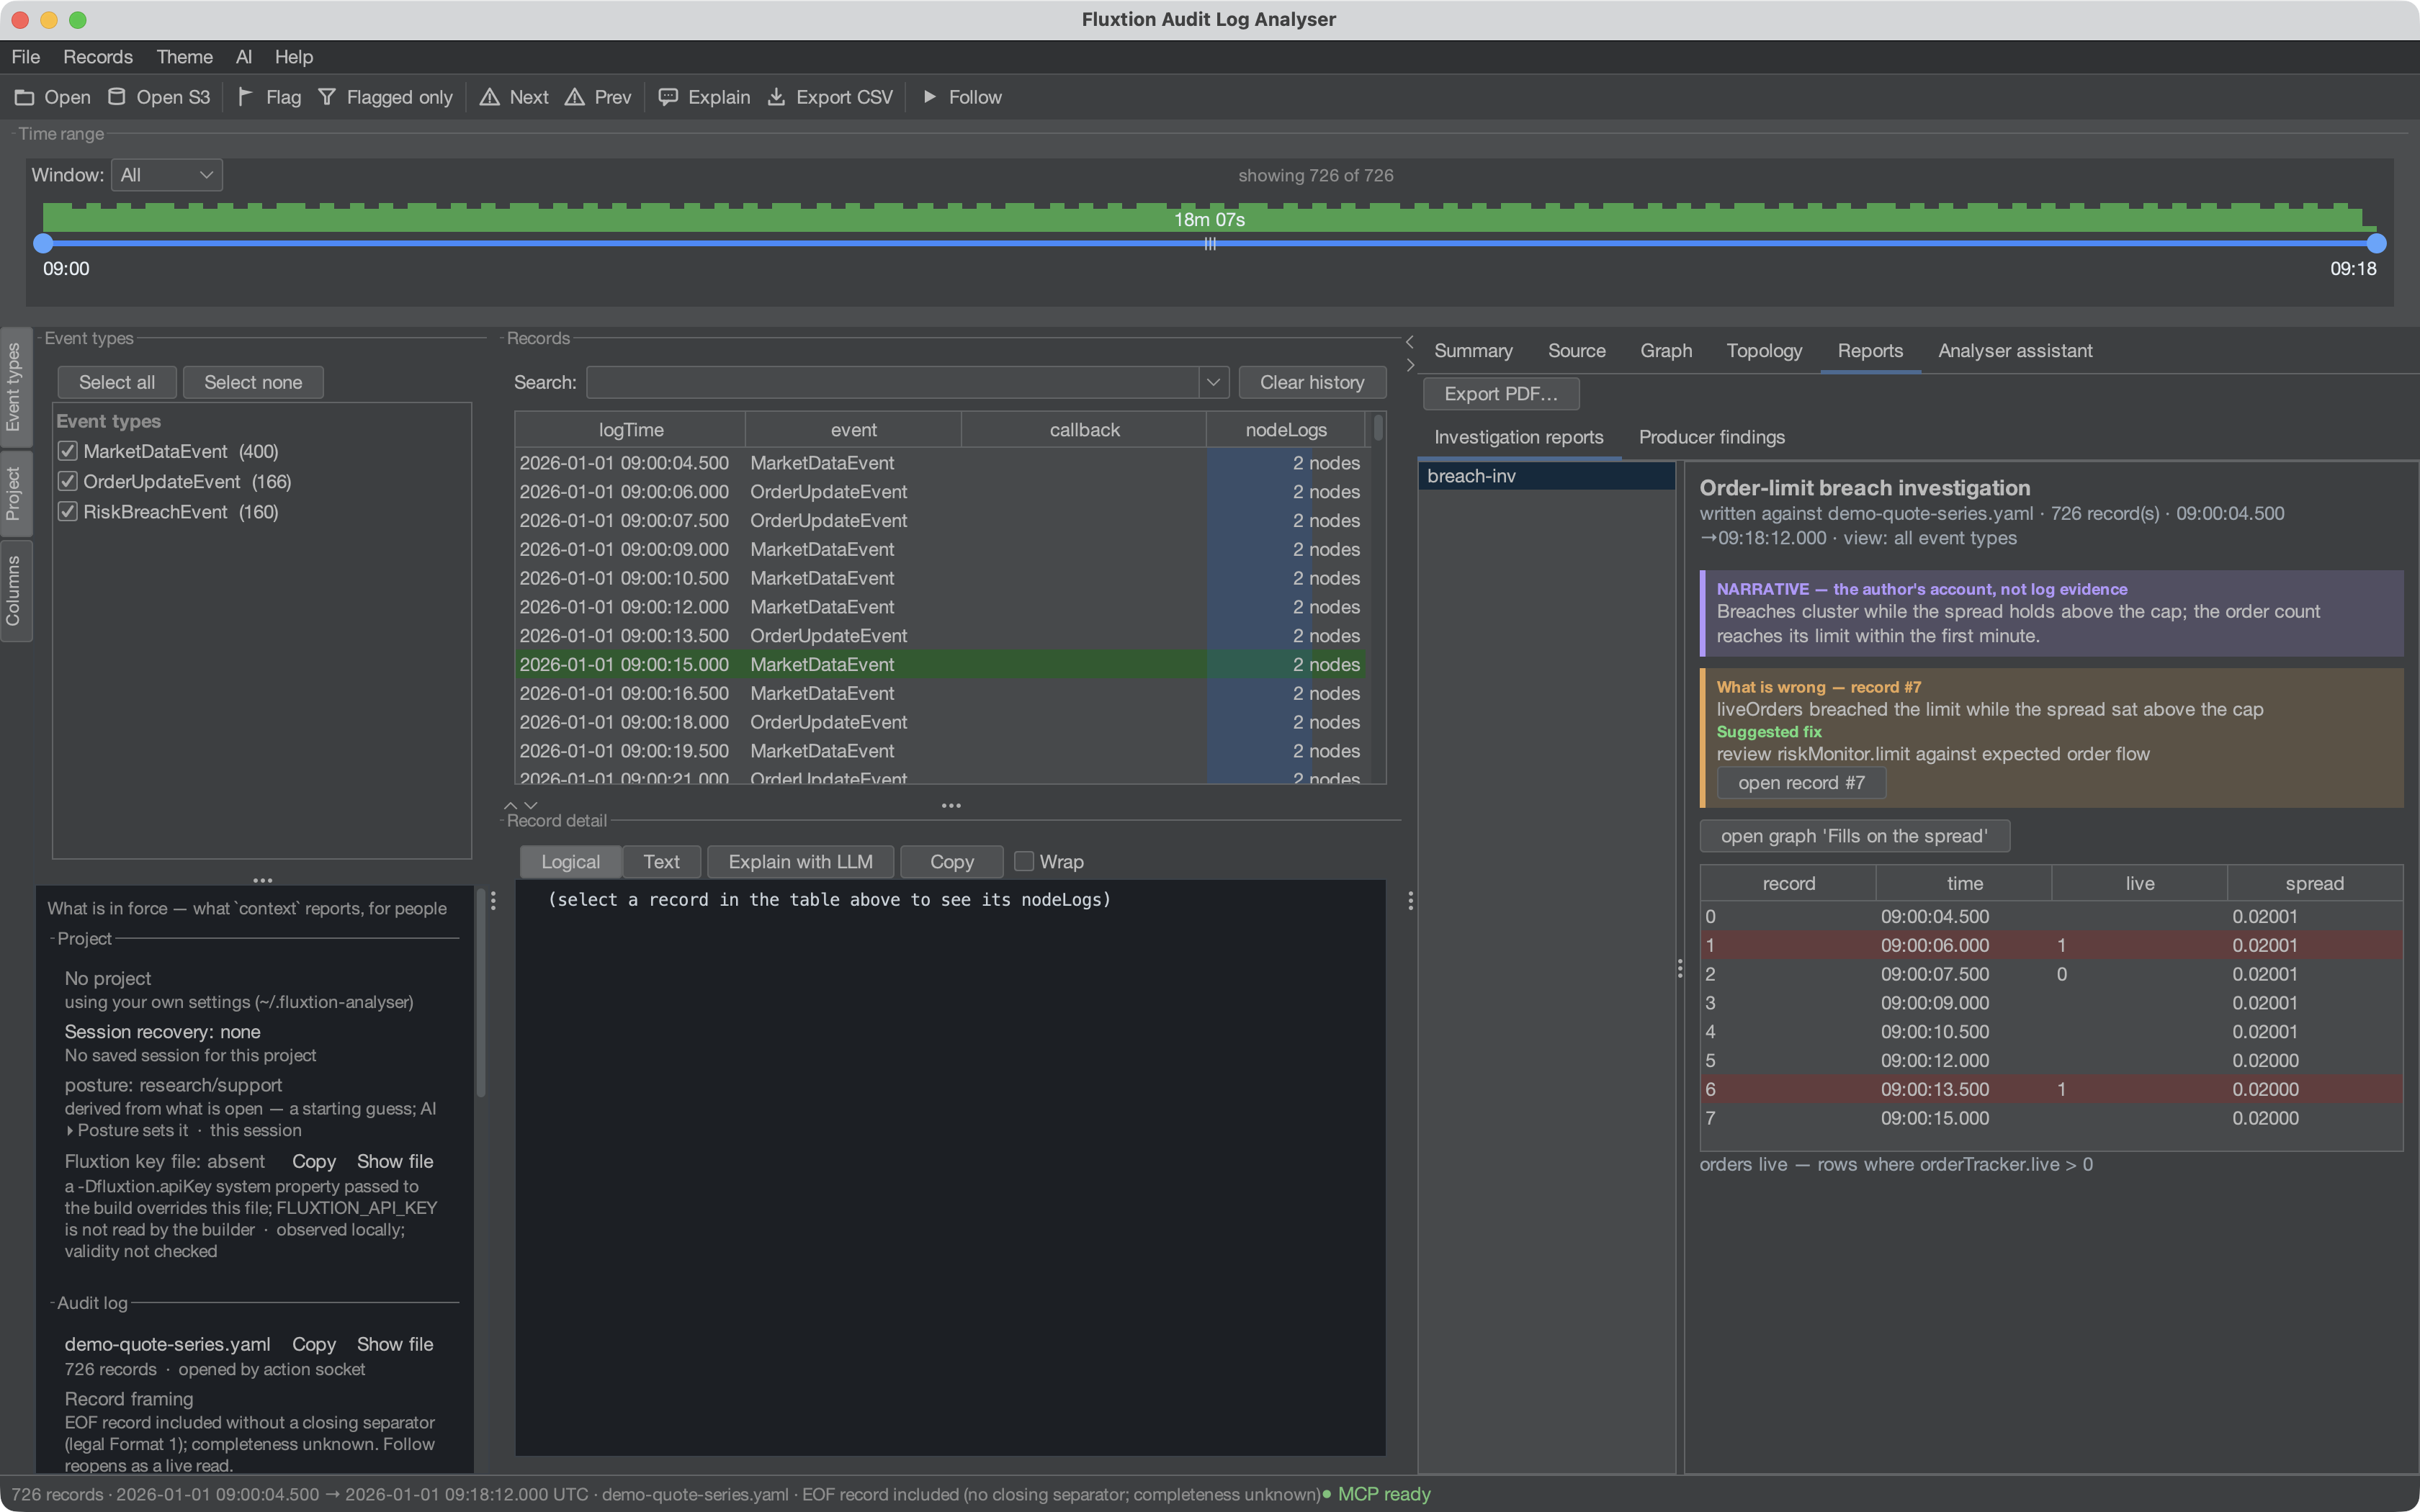
Reports appear in the Reports tab: pick one and its sections render in order, each evidence section clickable through to the thing it references — a finding selects its record, a chart opens that graph, a focus applies on the topology. A report is a navigation surface, not just an output.
Building one
Agents (or you, over REST) use the report verb:
{"name": "oversell-inv", "title": "Oversell investigation",
 "sections": [
   {"kind": "finding", "recordIndex": 99},
   {"kind": "chart", "graph": "stock vs revenue"},
   {"kind": "table", "call": {"verb": "read", "fields": "stockLedger.onHand, till.gross"},
    "rowWhen": "stockLedger.onHand < 0", "rowWhenLabel": "oversold"},
   {"kind": "narrative", "text": "Revenue is priced from the request, not from what the shelf could supply."}
 ]}
Re-issuing with the same name replaces the report. Add path to render the PDF, or
csv: 2, path: "rows.csv" to export that table's rows — both write inside the exchange directory
under the same Allow assistant file exchange opt-in as every other file the assistant writes.
The Reports tab has the same door for you: Export PDF… renders the selected report to a file you
choose — your chooser is the consent, so it is not confined to the exchange directory.
Reports persist with your profile, travel with projects, and share under their own category — because a shared report carries narrative written about your data, which deserves its own consent checkbox. See Sharing setups.