Sample conversations — an LLM, MCP, and the analyser
Seven short conversations on the demo set that ships in the jar. The tool calls and echoes are collapsed — open one to see the wiring. The asks and the agent's answers are written by hand; every tool call and every echo between them was recorded from a real run by tools/capture-conversations.py, under the same isolated home the screenshots come from — so when a verb's echo changes, this page changes with it rather than quietly going stale. Each conversation ends with what the person sees, because the answer is meant to land in the analyser, not in the chat (The shared research canvas).
The client discovers one tool per verb — analyser_context, analyser_aggregate, analyser_read, analyser_flag, analyser_coverage, analyser_topology, analyser_goto, analyser_graph, analyser_report, analyser_open … — so nothing below is pasted into a prompt; the agent reads the schemas and decides. Connecting an LLM to the analyser covers the setup.
1 · "What happened around 09:00?" — the answer lands as flags, not prose
You: The quote service looked wrong at 09:00 today. Use the fluxtion-analyser tools: what happened, and mark the records I should look at.
→ analyser_context
→ analyser_context {}
← {
  "log": {
    "path": "…/analyser/src/test/resources/topology/demo-quote-audit.yaml",
    "openedFrom": "…/analyser/src/test/resources/topology/demo-quote-audit.yaml",
    "records": 10,
    "sizeBytes": 4053,
    "from": 1767258000090,
    "to": 1767258000360,
    "openedBy": "the command line that started this analyser",
    "freshness": {
      "reload": "explicitly reopen the same path; no automatic replacement",
      "members": [
        {
          "loaded": "{…}",
          "onDisk": "{…}",
          "state": "unchanged-metadata"
        }
      ],
      "state": "unchanged-metadata",
      "basis": "size, modification time and file identity; unchanged metadata does not prove identical bytes"
    },
    "following": false,
    "supportsFollow": true,
    "trailingRecordsIncluded": 1,
    "tailNote": "EOF record included without a closing separator (legal Format 1); completeness unknown. Follow reopens as a…",
    "trailingRecordsPending": 0
  },
  "graphPairing": {
    "graph": "demo-quote-processor.graphml",
    "applies": true
  },
  "showing": {
    "visible": 10,
    "total": 10
  }
}
Ten records in the snapshot, including the EOF record without a closing separator; completeness remains unknown. The graph declares the logged nodes. Silence still does not prove non-execution. The agent starts wide, then narrows.
→ analyser_aggregate
→ analyser_aggregate {"groupBy": "dimension"}
← {
  "metric": "count",
  "groupBy": "dimension",
  "total": 10,
  "buckets": [
    {
      "key": "OrderUpdateEvent",
      "count": 4
    },
    {
      "key": "MarketDataEvent",
      "count": 3
    },
    {
      "key": "ExportFunctionAuditEvent",
      "count": 2
    },
    "… (+1 more)"
  ],
  "population": {
    "records": 10,
    "filter": {
      "dimensions": [],
      "from": null,
      "to": null,
      "text": null
    },
    "scan": "index"
  }
}
→ analyser_read
→ analyser_read {"recordIndex": 7}
← {
  "records": [
    {
      "recordIndex": 5,
      "byteOffset": 2131,
      "logTime": 1767258000240,
      "text": "eventLogRecord: \n    eventTime: 1767258000230\n    logTime: 1767258000240\n    groupingId: null\n    event: Or…"
    },
    {
      "recordIndex": 6,
      "byteOffset": 2541,
      "logTime": 1767258000270,
      "text": "eventLogRecord: \n    eventTime: 1767258000260\n    logTime: 1767258000270\n    groupingId: null\n    event: Or…"
    },
    {
      "recordIndex": 7,
      "byteOffset": 3019,
      "logTime": 1767258000300,
      "text": "eventLogRecord: \n    eventTime: 1767258000290\n    logTime: 1767258000300\n    groupingId: null\n    event: Ri…"
    },
    "… (+2 more)"
  ]
}
→ analyser_flag
→ analyser_flag {"recordIndexes": [6, 7], "note": "live orders reached the risk limit — the breach that follows is routine here, but the spread moved first"}
← {
  "flagged": 2,
  "recordIndexes": [
    6,
    7
  ],
  "note": "live orders reached the risk limit — the breach that follows is routine here, but the spread moved first"
}
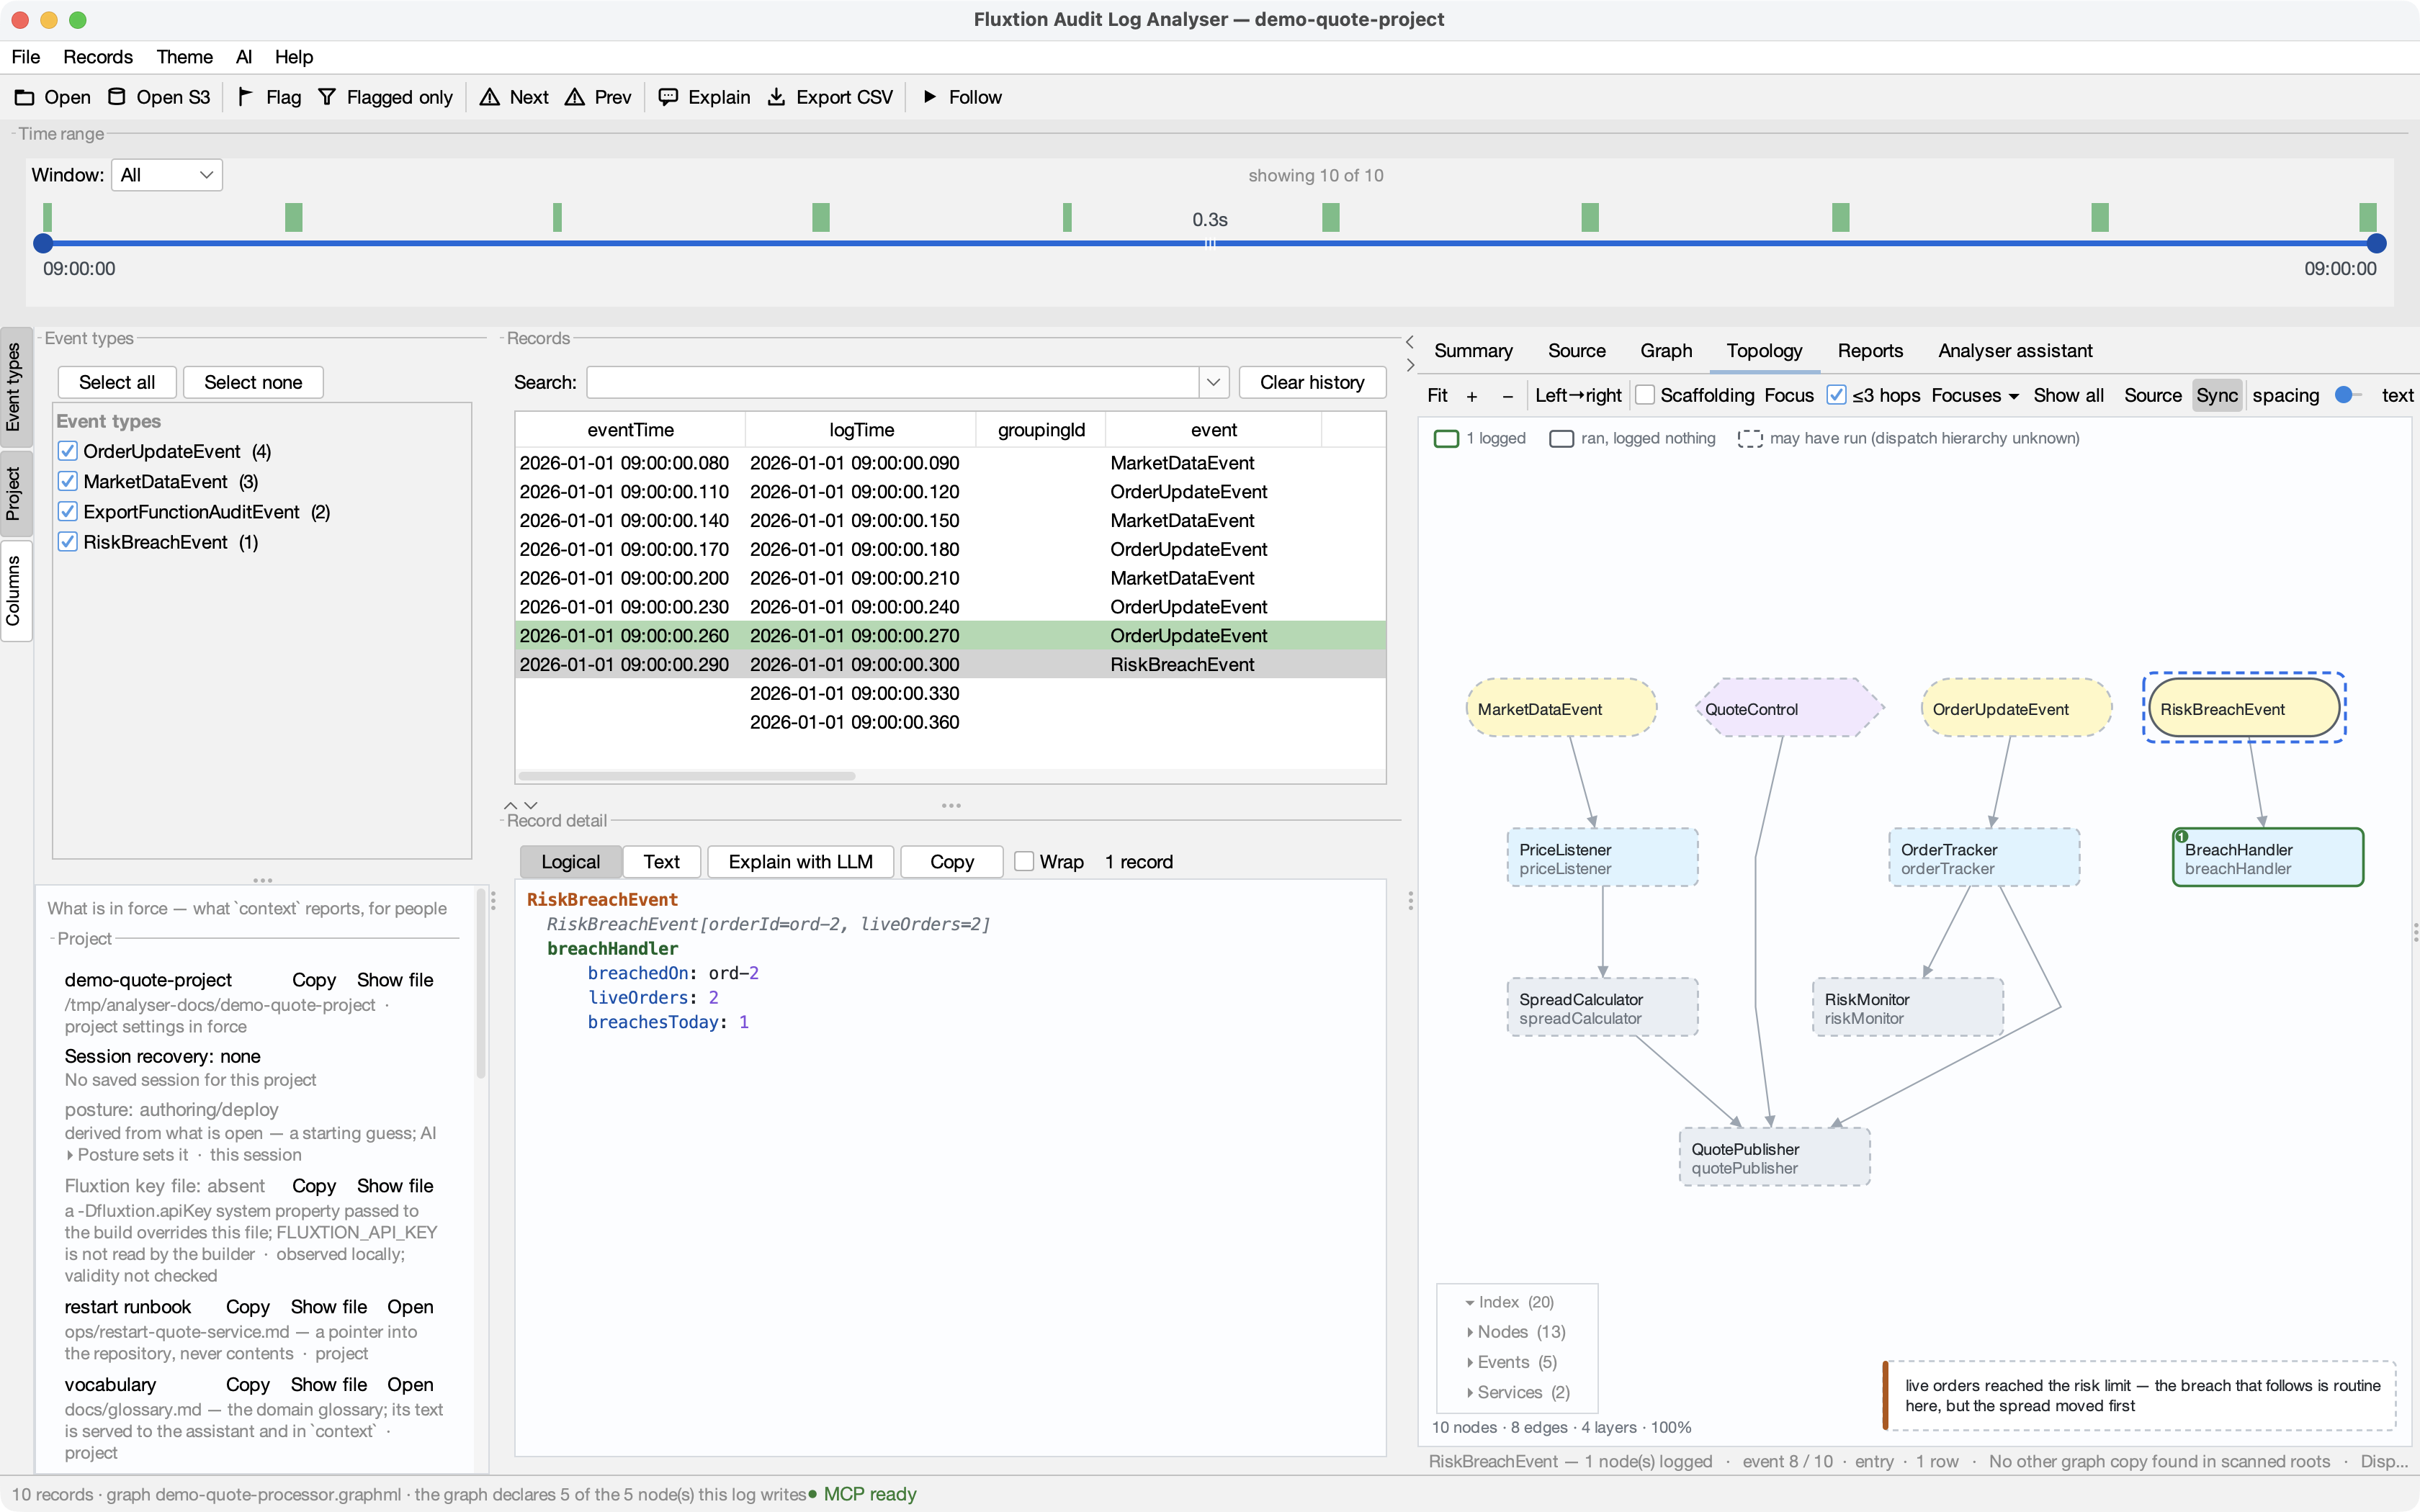
Agent: At 09:00:00.300 a RiskBreachEvent fired:
breachHandlerrecordedbreachedOn: ord-2with two live orders. The cycle before it (09:00:00.270) is the one that took liveOrders to the limit — I've flagged both with a note; they're the yellow rows in your table and the Flagged only toggle shows just them. The final EOF record is included; a missing closing separator does not establish whether the file is whole.
2 · "Which nodes never ran?" — coverage that counts only what could log
You: Which nodes in this processor never logged anything in this run?
→ analyser_coverage
→ analyser_coverage {}
← {
  "declared": 5,
  "covered": 5,
  "uncovered": 0,
  "ratio": 1.0,
  "excludedFromDenominator": {
    "spreadCalculator": "this class cannot reach an audit logger at all — it declares no supertype, so it has no auditLog to write with",
    "MarketDataEvent": "an event class — data entering the graph, not code that runs",
    "QuoteControl": "an exported service interface — an entry point, not a node that logs",
    "OrderUpdateEvent": "an event class — data entering the graph, not code that runs",
    "RiskBreachEvent": "an event class — data entering the graph, not code that runs"
  },
  "excludedNote": "excluded 5 declared item(s) that can never write audit output: 3 event class(es), 1 exported service(s), 1 …"
}
Agent: Every node that can log did — five of five. Five other things in the graph were left out of the denominator on purpose and the echo names each one with its reason: three event classes and the
QuoteControlservice interface can never write audit output, andspreadCalculatorcannot either — its class declares no supertype, so there is noauditLogfor it to write with. Counting all five would have reported 50% for a run that logged everything it could.Read that last exclusion carefully, though, because the echo is careful about it too:
spreadCalculatorbeing unable to log is not the same as it being fine. It is not observable in any audit log, so this 100% says nothing about whether it ran — proof-of-absence simply does not reach it. If you need to know that it ran, it needs an audit logger before the next capture.
3 · "Why is this number what it is?" — one value followed back through the graph
You: The spread in the 09:00:00.270 cycle is 0.011. Show me where that comes from.
→ analyser_topology
→ analyser_topology
Agent:
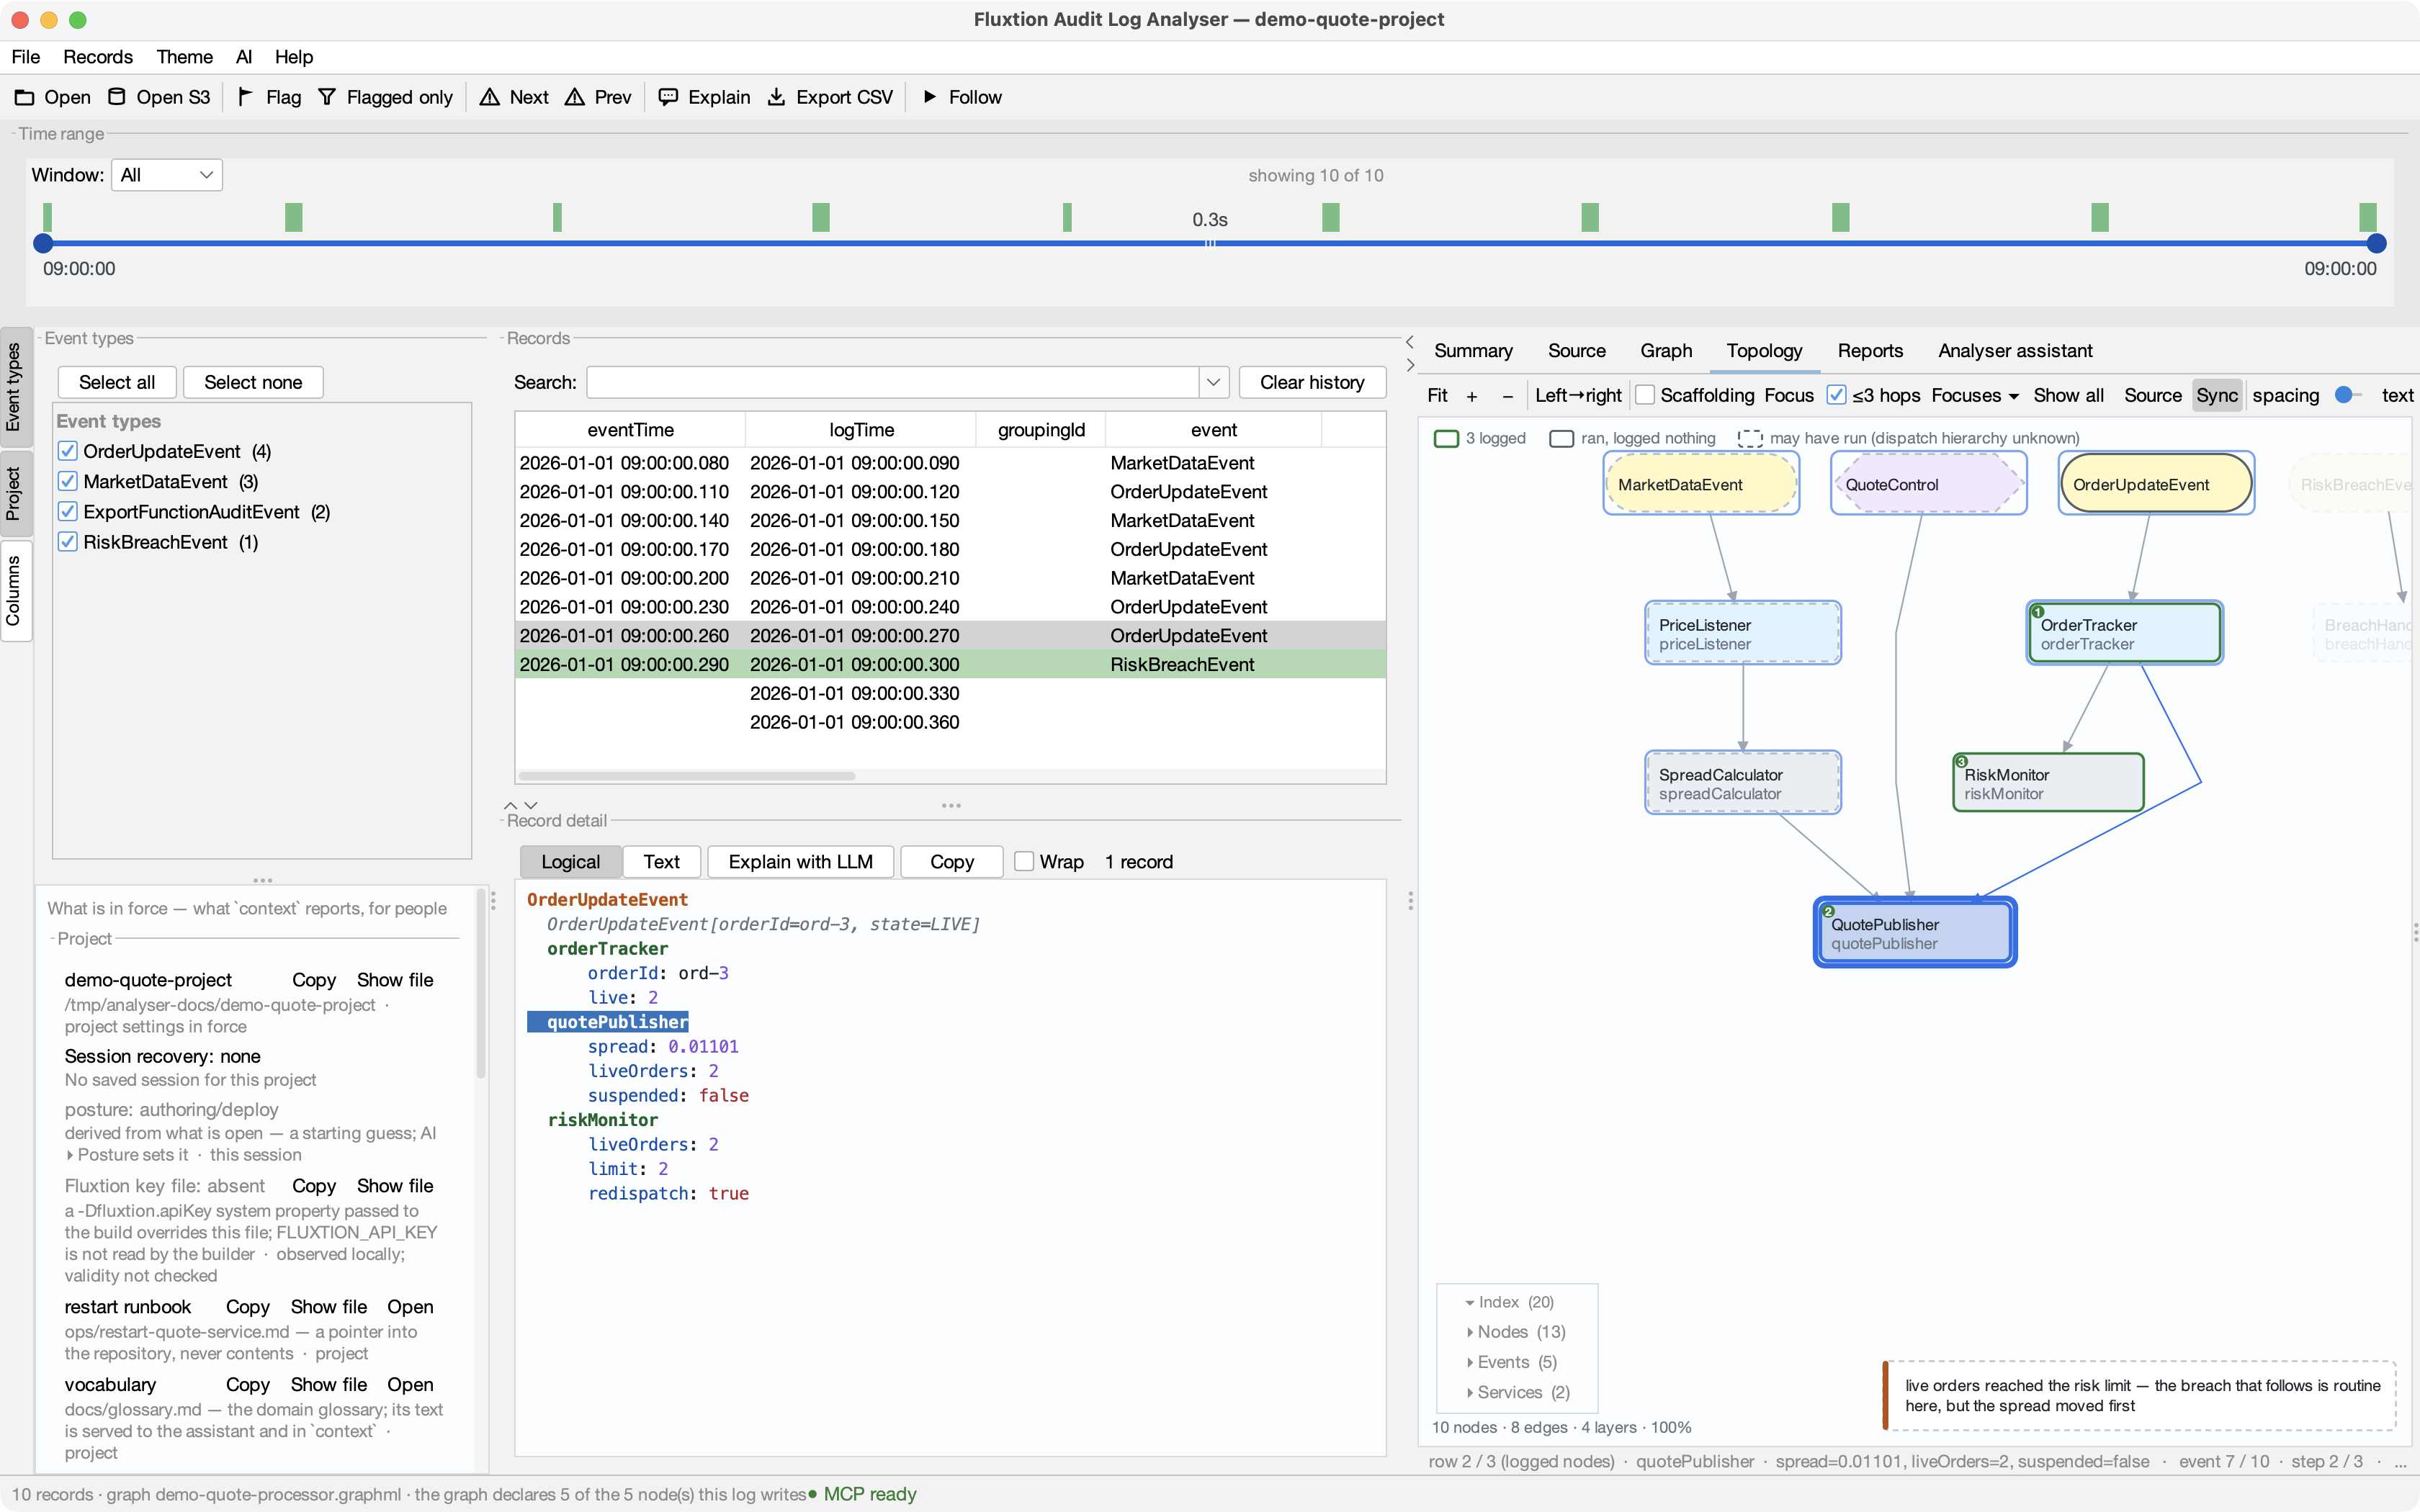
quotePublisher.spreadis computed fromspreadCalculator, which listens topriceListener— the Topology tab is now focused on exactly those routes, and I've stepped the 09:00:00.270 cycle to the second node it dispatched —quotePublisher, afterorderTracker.spreadCalculatorcannot write audit output at all (conversation 2), so the 0.011 you see isquotePublisherreporting a value it was handed, and no audit log will ever let us trace it further — that is a property of the build, not of this run. Position within the cycle is dispatch order here (orderMeaningful: true), so the sequence you're looking at is causal.
4 · "Chart it and write it up" — a graph with its reason, and a report that leaves the session
You: Open the longer run and chart the spread against live orders; then write it up as a report I can send.
→ analyser_graph
→ analyser_report
→ analyser_report {"name": "spread-vs-live", "title": "Spread widens while orders are live", "sections": [{"kind": "narrative", "text": "Every widening of the spread in this run coincides with live orders; the chart shows the two series moving …"}, {"kind": "record", "recordIndex": 12}, {"kind": "table", "call": {"verb": "aggregate", "metric": "count", "groupBy": "dimension"}}], "path": "spread-vs-live.pdf"}
← {
  "path": "<exchange-dir>/spread-vs-live.pdf",
  "sections": 3,
  "name": "spread-vs-live"
}
→ analyser_report
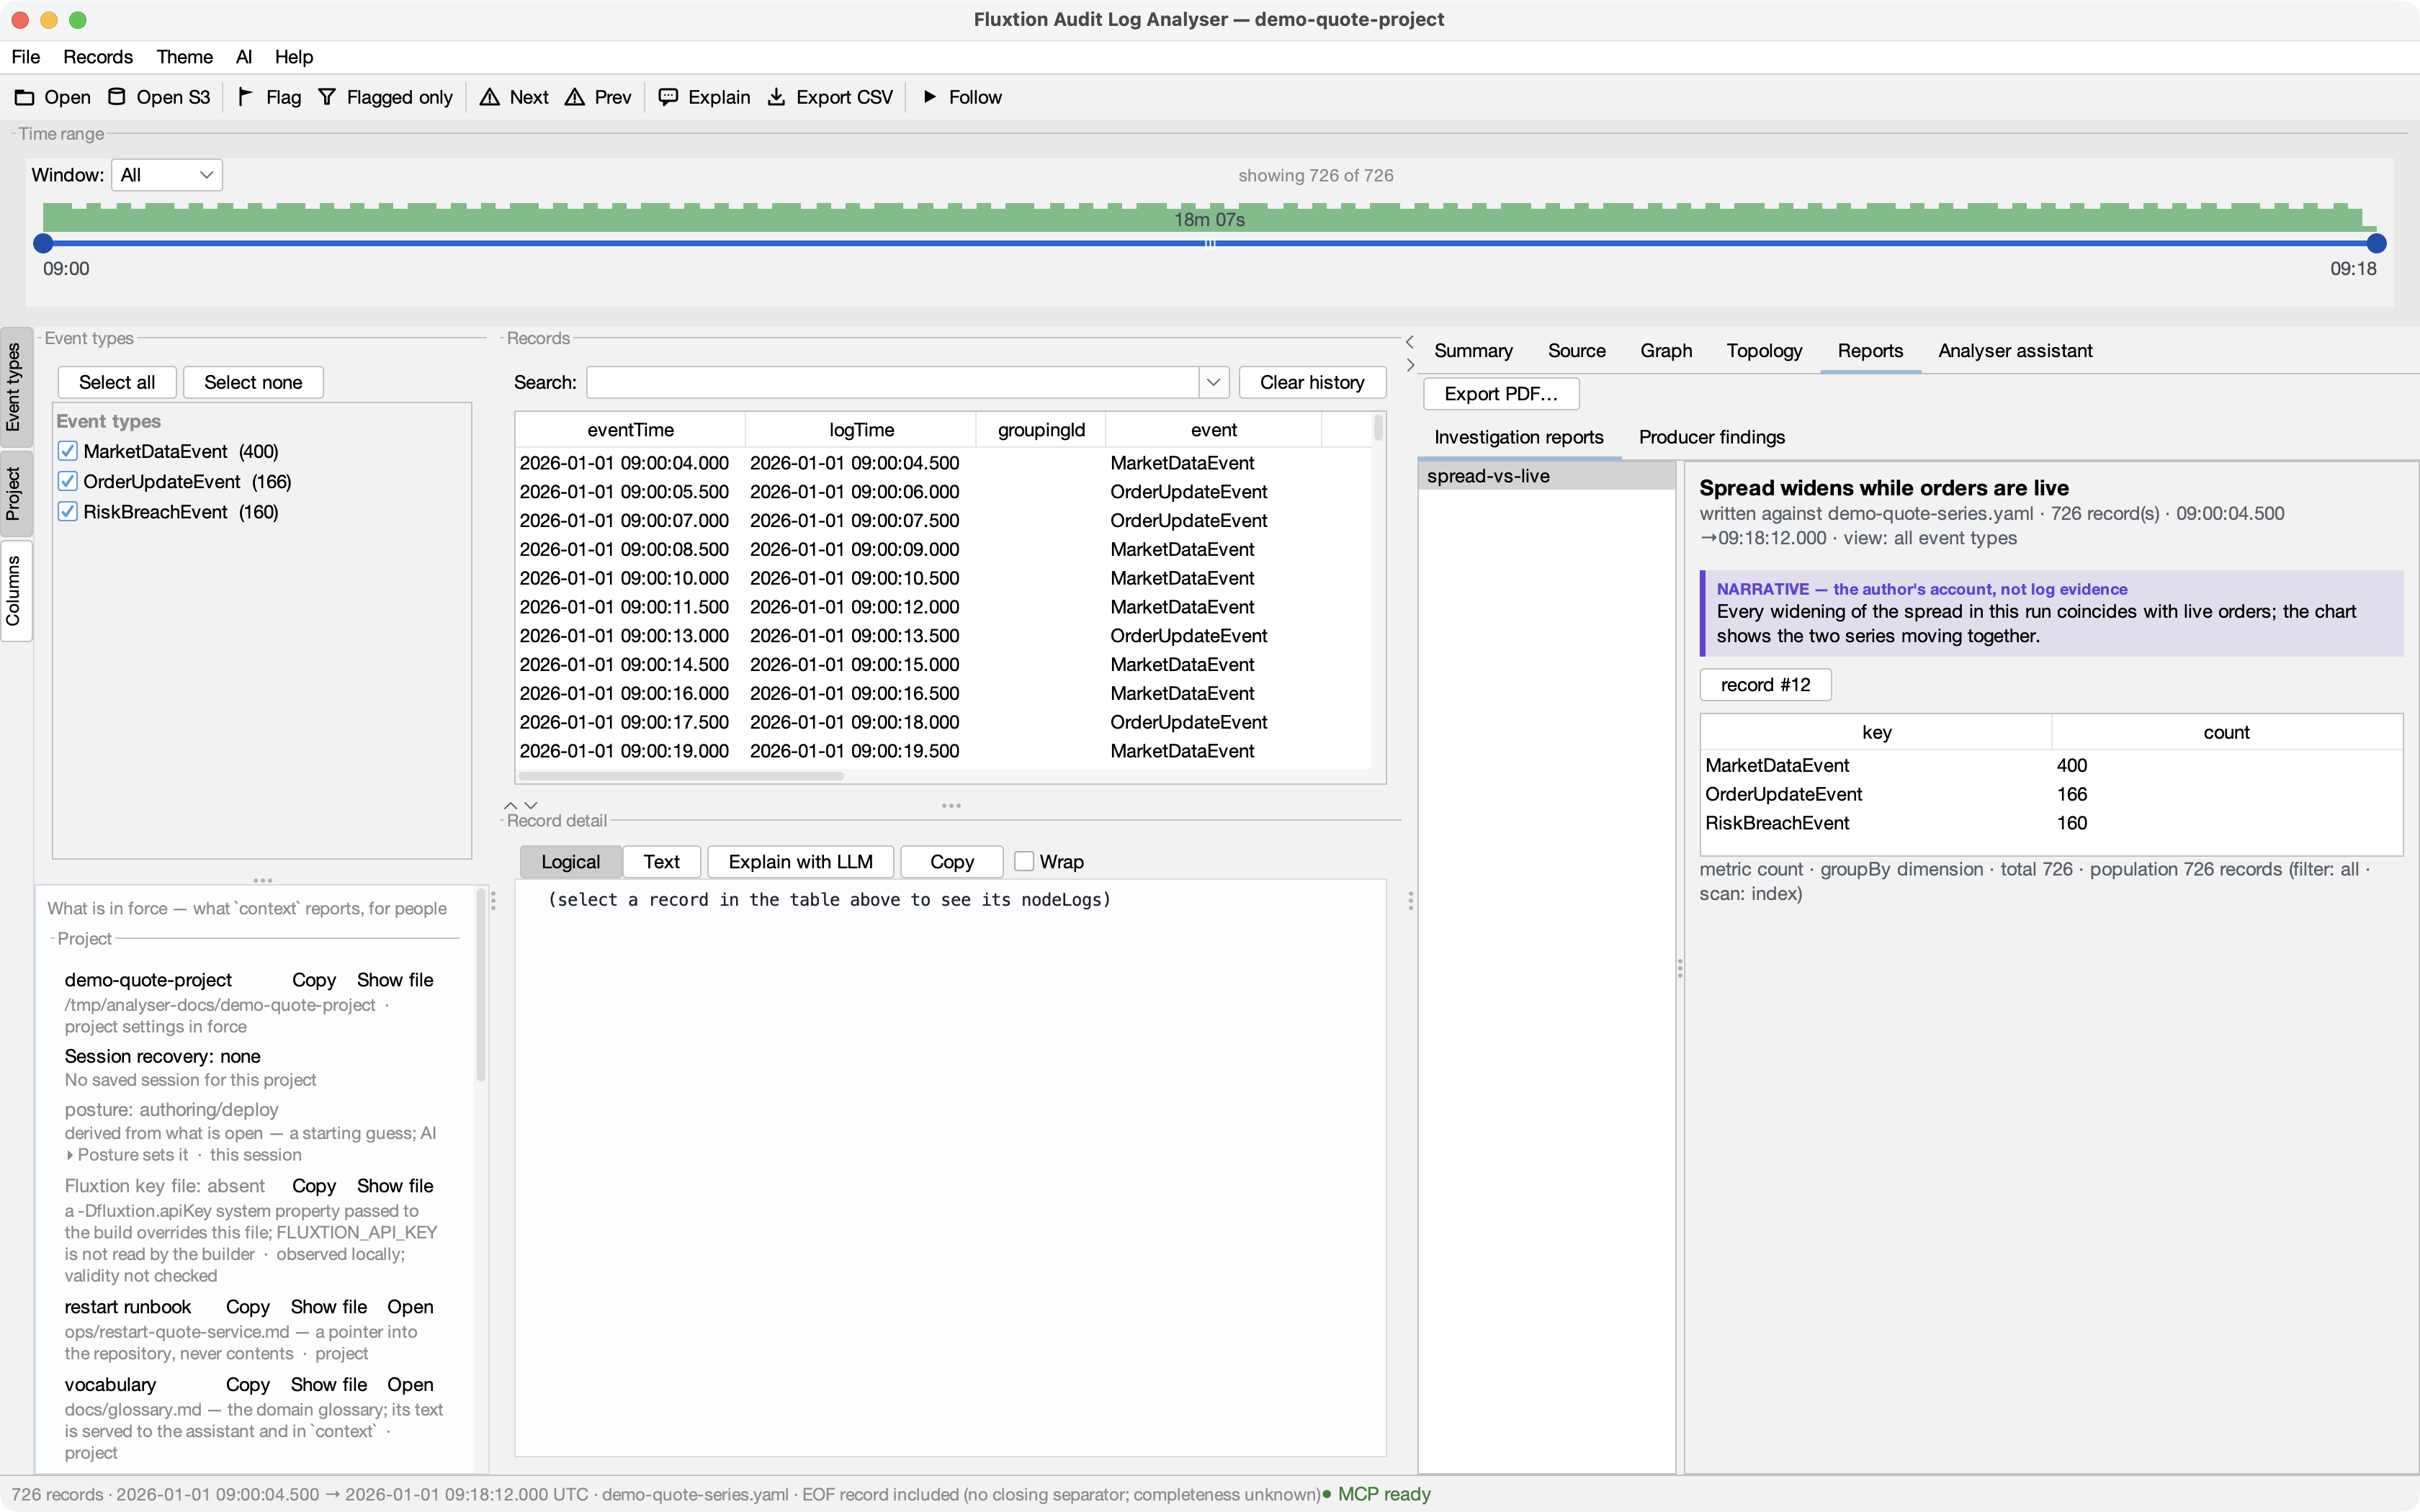
Agent: The chart is on your Graph tab — spread on the left axis, live orders on the right, captioned with why I drew it. The report is saved in the project as spread-vs-live and rendered to the exchange directory as
spread-vs-live.pdf. Its aggregate table is also exported as CSV, so the report carries the event population rather than a hand-picked short sample; its header names the log it was written against, so whoever receives it can check it against the same file.
5 · "Use what the project knows" — runbooks, glossary, a saved analysis
You: Is there a standard analysis for this kind of incident, and what does the team do next?
→ analyser_context
→ analyser_context {}
← {
  "runbooks": [
    {
      "name": "restart",
      "path": "ops/restart-quote-service.md",
      "resolved": "…/demo-quote-project/ops/restart-quote-service.md",
      "exists": true,
      "from": "project",
      "note": "a pointer — read the file from the repository; the analyser stores no instructions and executes nothing"
    }
  ],
  "vocabulary": {
    "path": "docs/glossary.md",
    "exists": true
  },
  "analyses": [
    {
      "name": "spread breach",
      "rationale": "every breach incident starts the same way: the spread before it",
      "parameters": [
        {
          "name": "log"
        }
      ],
      "steps": [
        "open",
        "graph"
      ],
      "from": "project"
    }
  ]
}
→ analyser_open
Agent: Yes — the project saves a spread breach analysis ("every breach incident starts the same way: the spread before it"). I ran it: it opened the incident log and drew
quotePublisher.spread. The glossary says a breach here is routine, not an outage. For what happens next the project points atops/restart-quote-service.md; I read it — confirm liveOrders is 0, restart through the deployment tool, verify the next log starts within 5 s. I have not run anything. (Runbooks, glossary and saved analyses with an AI has this conversation in full.)
6 · "Deploy the fix to UAT and show me it worked" — the analyser's part is the proof
You: Deploy the spread fix to UAT using the team's runbook, then show me the UAT run is healthy.
→ analyser_context
→ analyser_context {}
← {
  "environments": [
    {
      "name": "uat",
      "provenance": "DEMO quote service · uat",
      "logDir": "logs/uat",
      "default": false
    }
  ],
  "runbooks": [
    {
      "name": "restart",
      "path": "ops/restart-quote-service.md",
      "resolved": "…/demo-quote-project/ops/restart-quote-service.md",
      "exists": true,
      "from": "project",
      "note": "a pointer — read the file from the repository; the analyser stores no instructions and executes nothing"
    }
  ]
}
The deploy itself happens outside the analyser: the agent reads ops/restart-quote-service.md with its own file tool and acts through the deployment side's own MCP surface (The build-with-AI loop). Nothing in the analyser can run a runbook, by design. When the UAT run has produced a log, the analyser's part begins — proving it.
→ analyser_open
→ analyser_context
→ analyser_coverage
→ analyser_report
→ analyser_report {"name": "uat-verification", "title": "UAT run after the spread fix", "sections": [{"kind": "narrative", "text": "Post-deploy verification of the UAT run: every node that can log did, and the traced run reached the nodes …"}, {"kind": "record", "recordIndex": 7}, {"kind": "table", "call": {"verb": "read", "recordIndex": 0, "count": 10, "fields": "quotePublisher.spread,quotePublisher.liveOrders"}}], "path": "uat-verification.pdf"}
← {
  "path": "<exchange-dir>/uat-verification.pdf",
  "sections": 3,
  "name": "uat-verification"
}
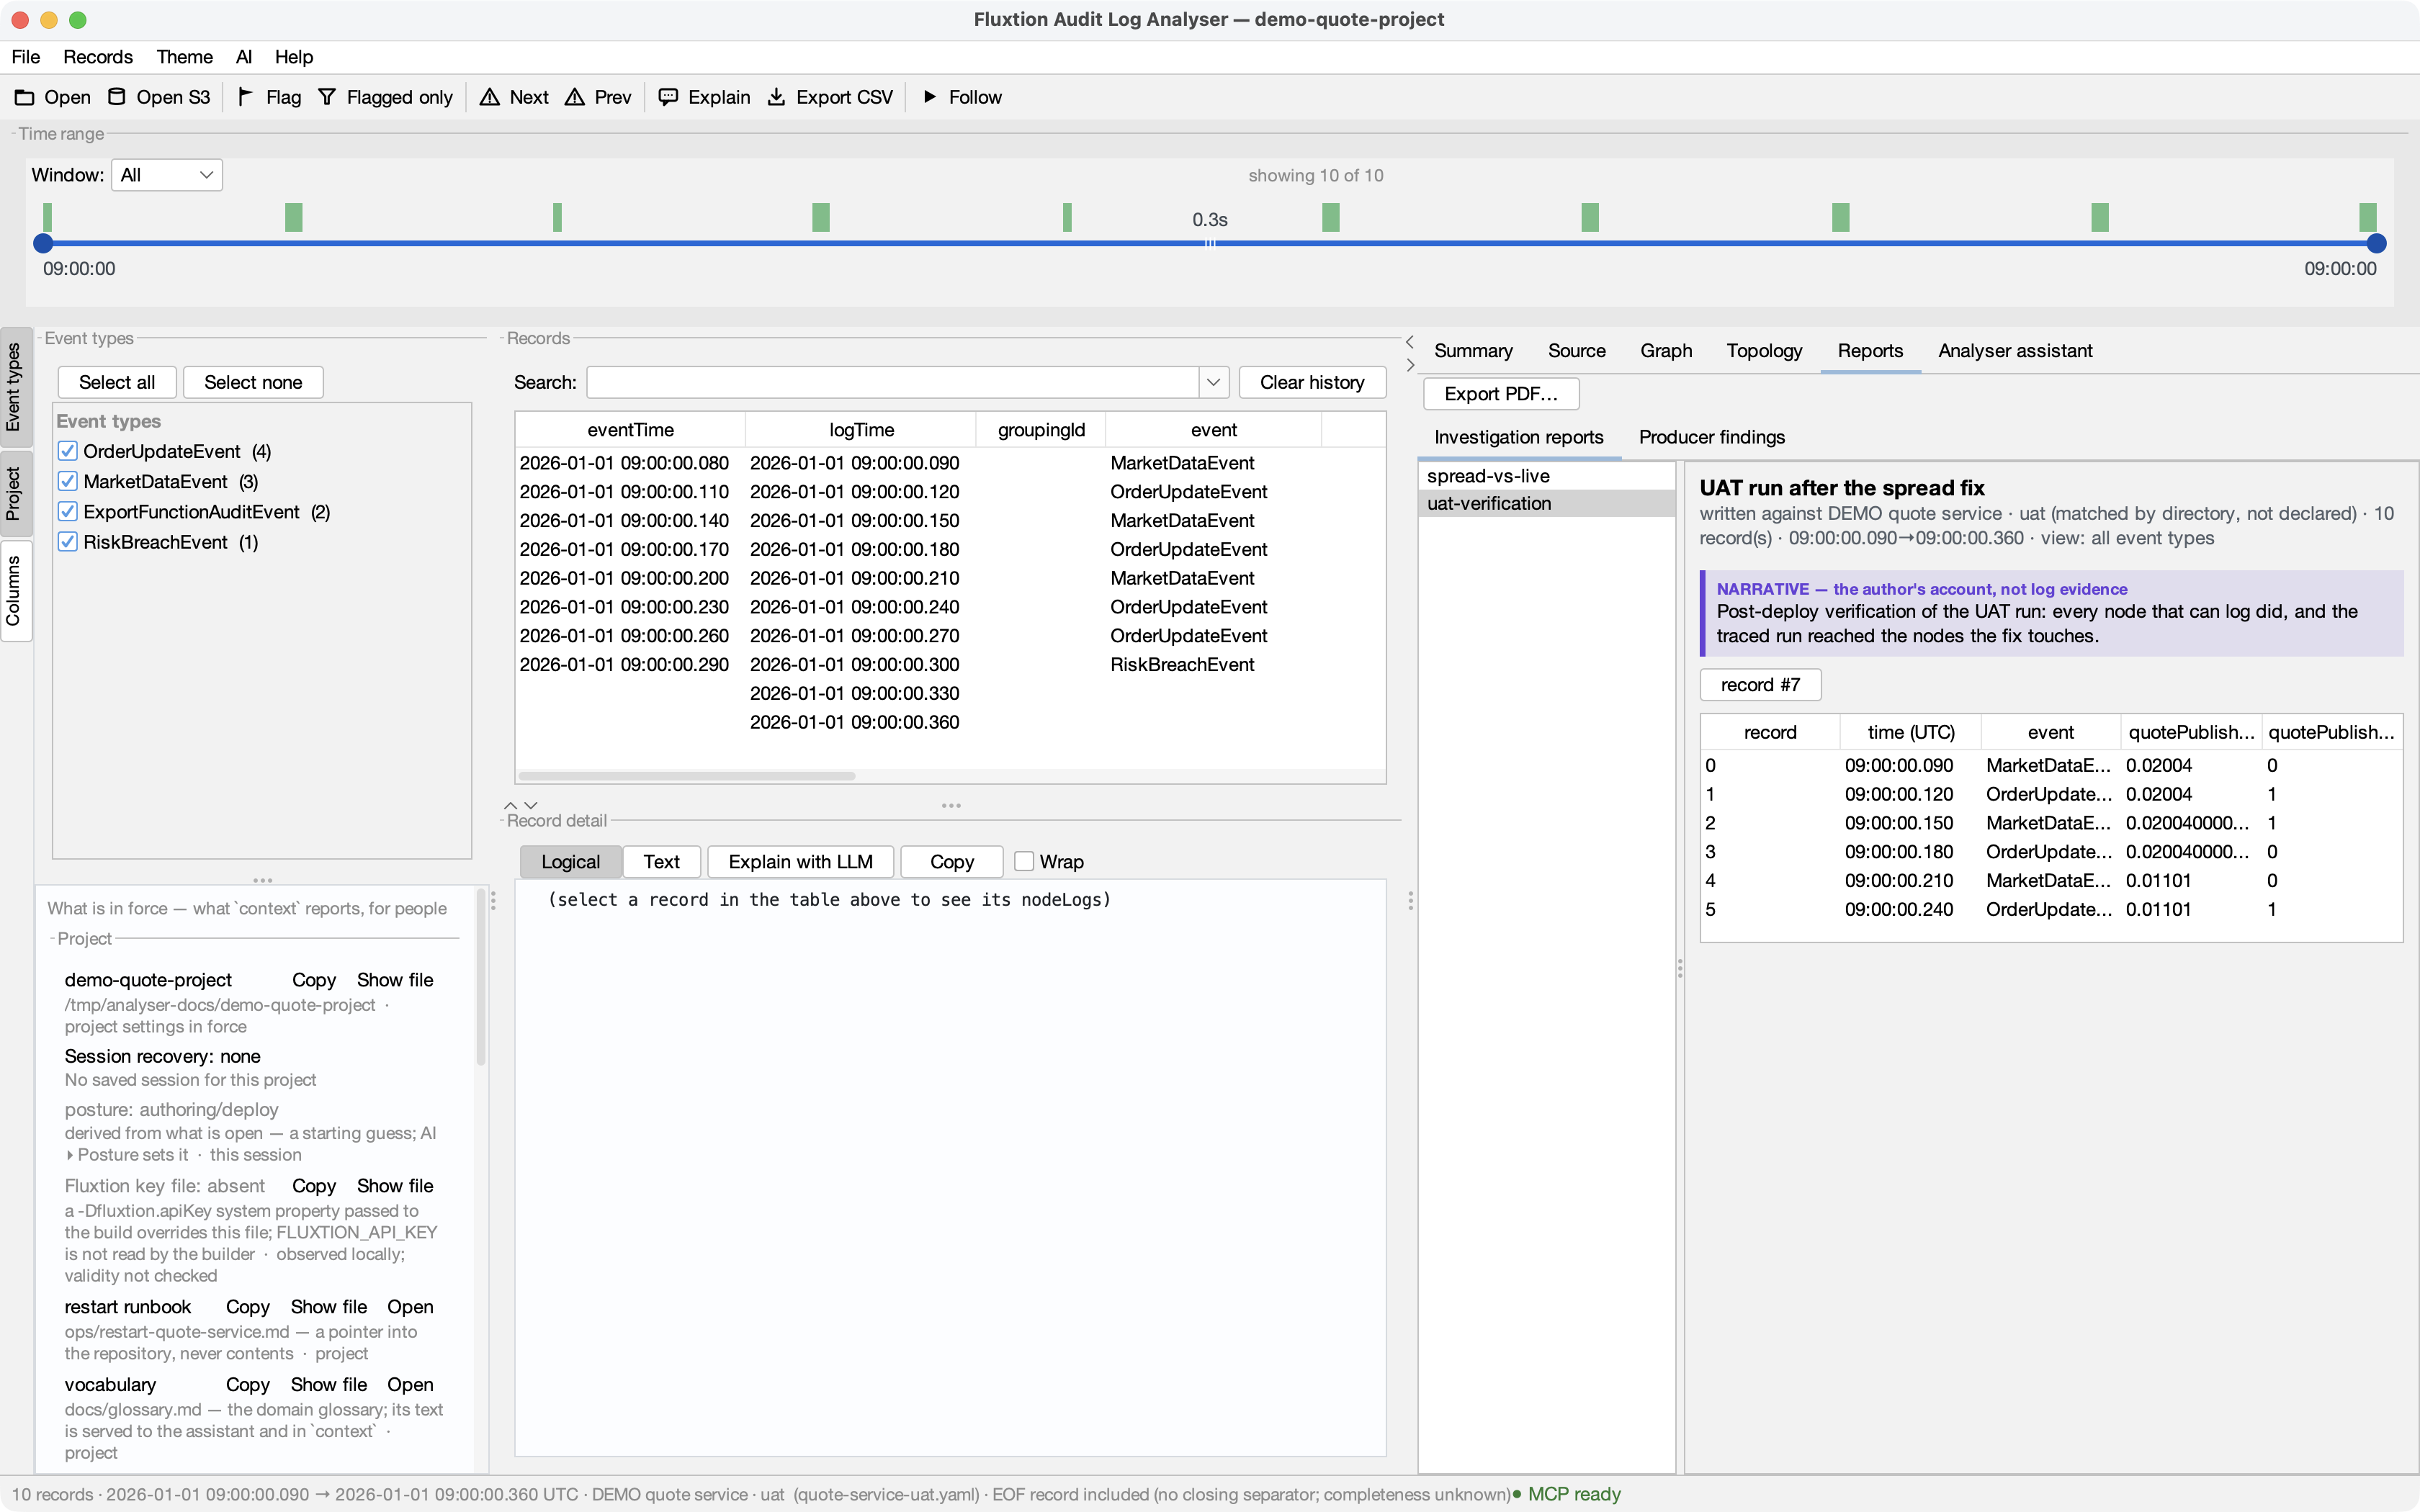
Agent: Deployed via the runbook's steps (through the deployment tool, not the analyser). The UAT log opened without me declaring where it came from — the project's environments say a log under
logs/uatis DEMO quote service · uat, soprovenanceSourcereads project environment 'uat' rather than a guess. Coverage on the run is 5/5 of what can log (the echo above); the write-up is on the Reports tab as uat-verification — the breach record and a table of spread and live orders per record — and the PDF's header says the provenance was matched by directory, not declared, so whoever reads it knows the label came from a filesystem convention, not from the system itself.
7 · "Will this processor log at all?" — an answer with no log to examine
You: Support say the audit log from the new build is empty. Here's the build's graph — is that expected?
→ analyser_open
→ analyser_open {"graphml": "…/analyser/src/test/resources/topology/demo-quote-processor-noaudit.graphml"}
← {
  "graphml": {
    "path": "…/analyser/src/test/resources/topology/demo-quote-processor-noaudit.graphml",
    "graphNodes": 18,
    "authoredNodes": 10,
    "copyComparison": {
      "roots": [
        "…/analyser/examples/fixture-generator/src/main/java",
        "…/analyser/src/test/resources/topology"
      ],
      "state": "pending"
    },
    "pairing": "no log is open — nothing to check this graph against"
  }
}
→ analyser_context
Agent: Expected, and not a quiet system: this build was compiled without audit logging —
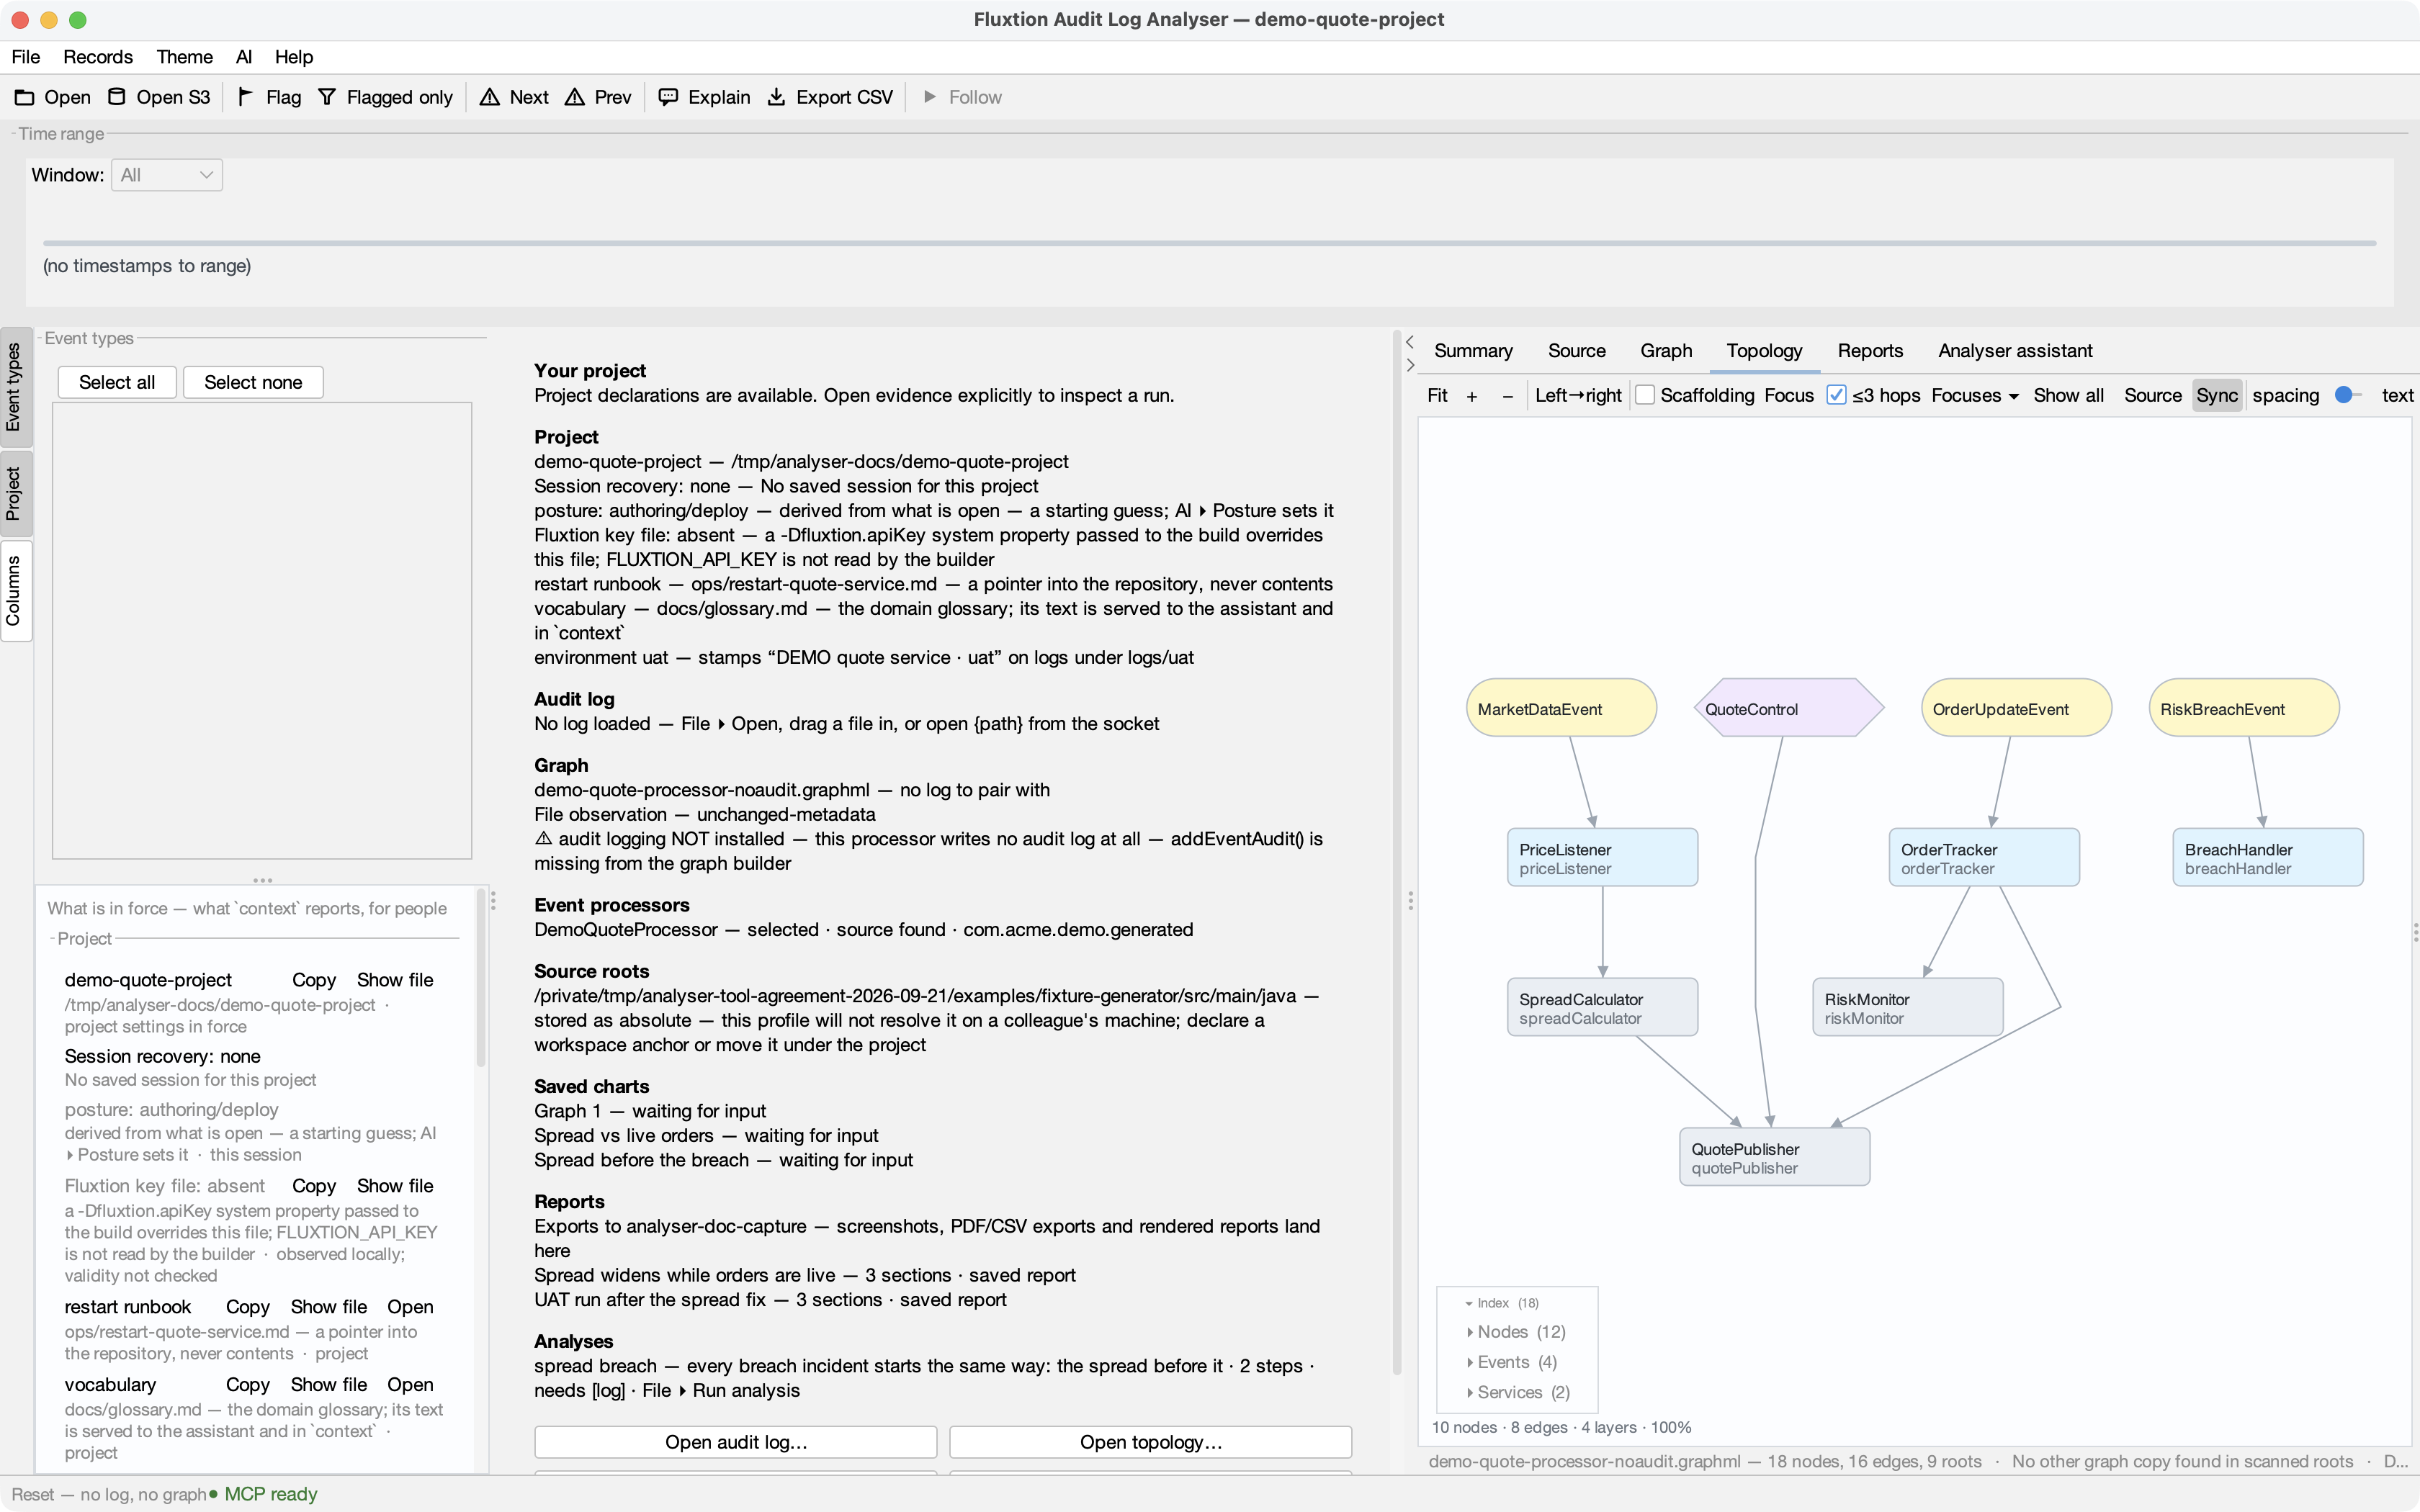
EventLogManageris not on the graph, so the processor writes no audit log at all, however carefully its nodes callauditLog.info(…). The fix isaddEventAudit()on the graph builder and a rebuild. I could tell you that from the graph alone, before any run — there was never going to be a log to read.
Regenerate with python3 tools/capture-conversations.py after mvn package. The calls above are the run's own; if one fails, the script stops rather than writing a page that pretends it worked.