Records, detail & filtering
These are the core surfaces — the ones you spend most time in. They're all views over the same Fluxtion audit log: the log is the source of truth, and the table, detail viewer, search, filter, summary, graphs and assistant are just different lenses on it. Narrow the view once and everything follows.
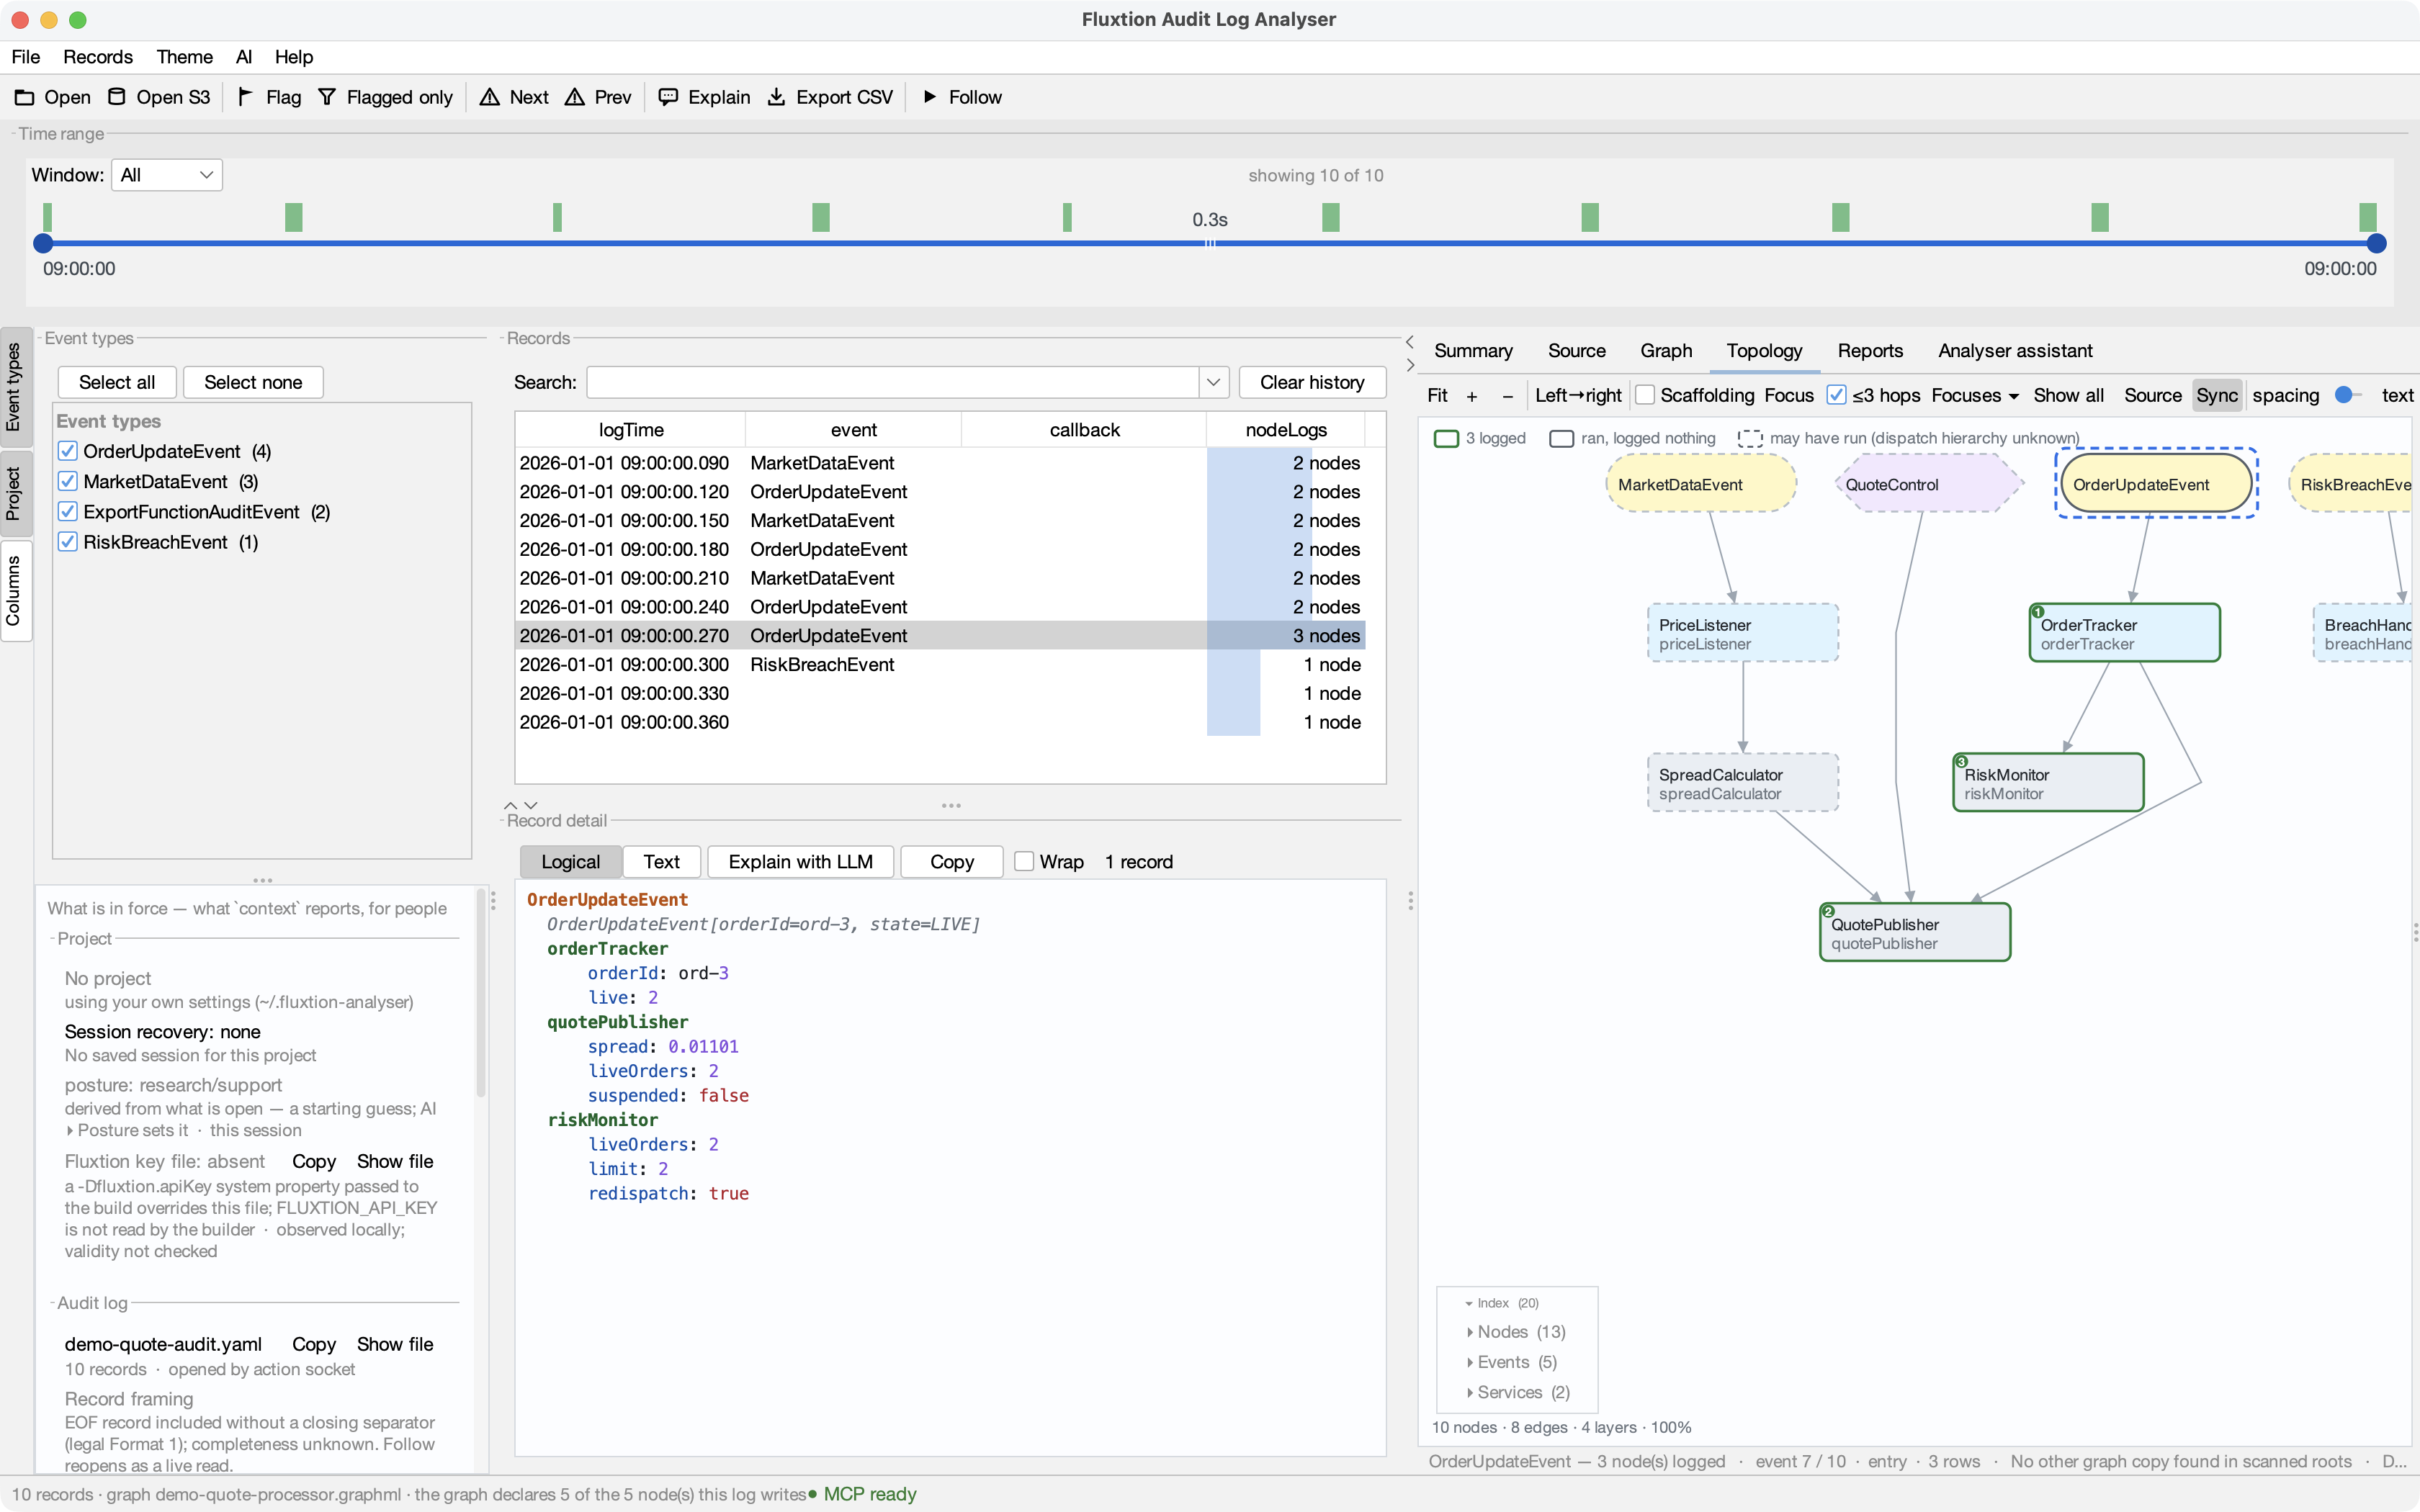
The main window at a glance:
- Time range (top) — a histogram + slider that bounds the visible window.
- Event types (left rail) — the dimension checklist that filters the log.
- Records (centre) — one row per cycle, with the search box above it.
- Record detail (below the table) — the selected record's
nodeLogs. - Right-hand tabs — Summary, Source, Graph and the Analyser assistant.
- Status bar (bottom) — record count, time span and the open file.
The records table
One row per event cycle (one propagation of the processor). Columns include the log time, the event, the callback, the thread and a node-count.
- Sort by clicking a column header; show/hide columns from the Columns menu.
- Select a row to load it into the detail viewer; Shift/⌘-click to select several (the assistant sends all of them).
- Anomaly tints — rows with a parse-error, a breach or a
NaNare highlighted; jump between them with ⚠ Next / ⚠ Prev (F3 / Shift+F3). - Right-click a row: Diff selected two records, Explain selected with LLM, Flag / unflag.
- Flag rows with F to bookmark findings; Records ▸ Show flagged only focuses on them; Records ▸ Copy selected as YAML copies them to the clipboard.
Flagging & focus
Flagging turns the log into a working set of findings. Press F (or Records ▸ Flag / unflag, or right-click ▸ Flag) to bookmark the selected rows — flagged rows are tinted so they stand out in context.
Toggle Flagged only (toolbar) to collapse the table to just the flagged records — a focused view of everything you (or the assistant) marked as relevant, while the counts and time range still reflect it. Records ▸ Clear all flags resets them.
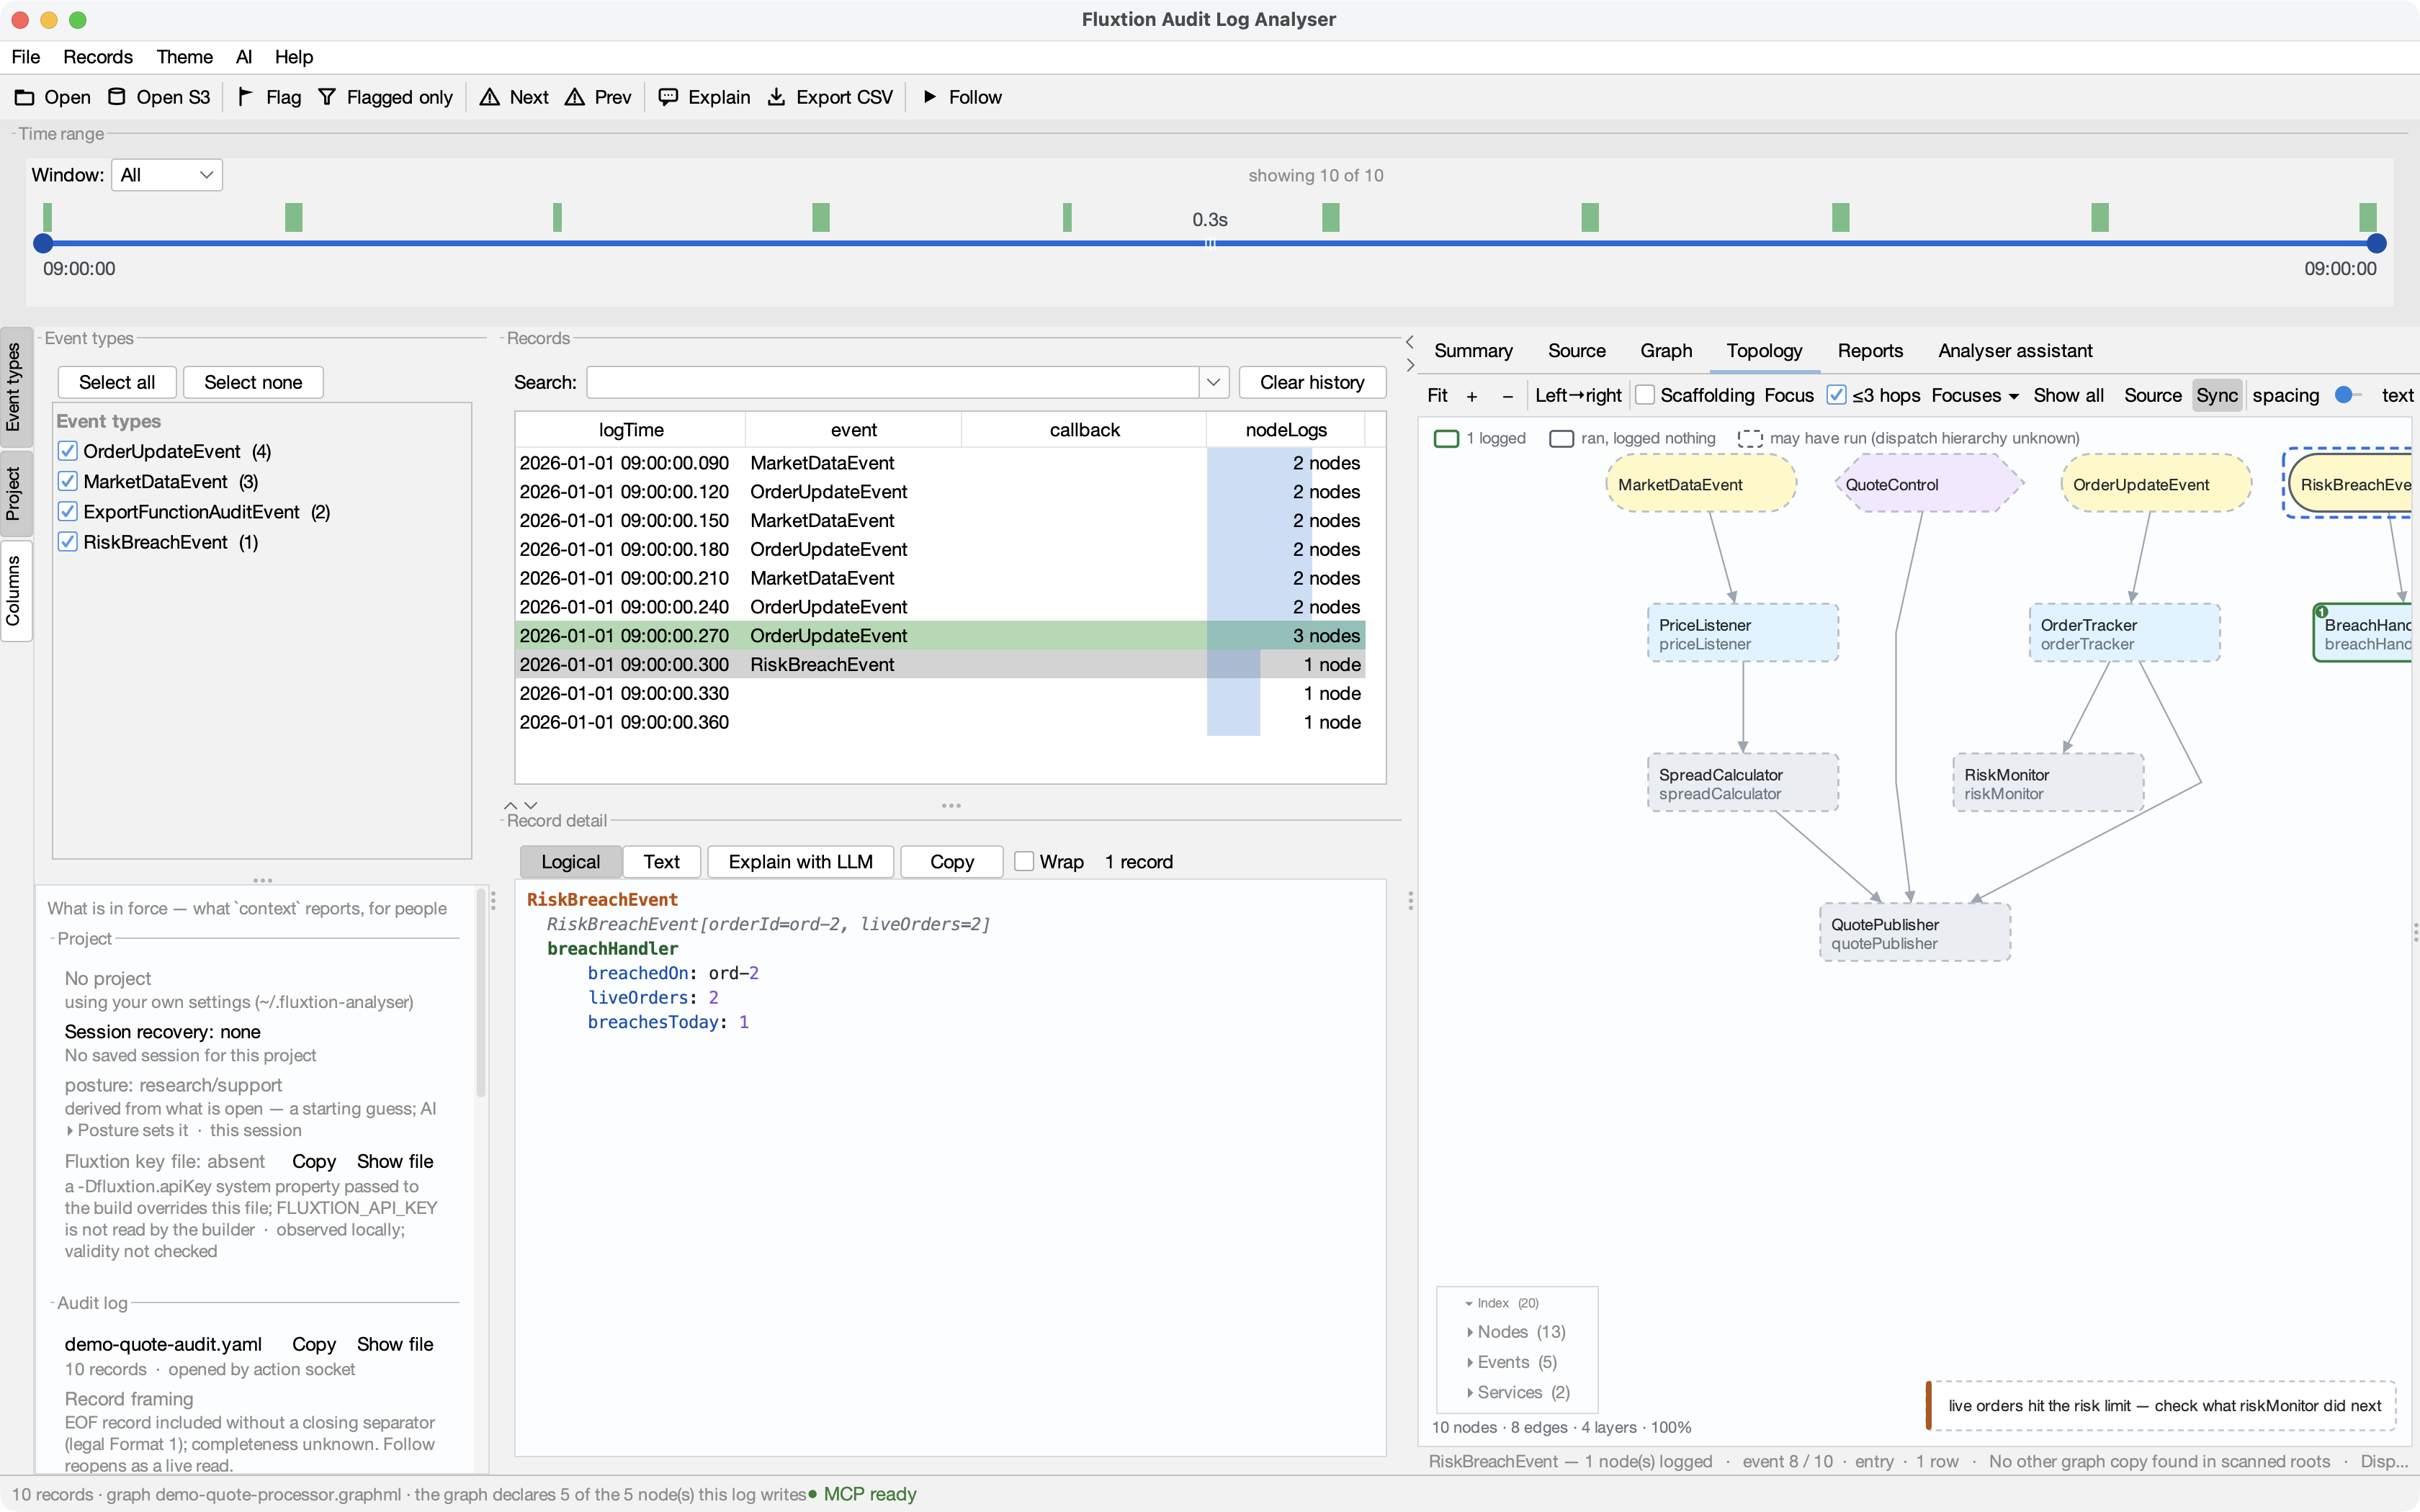
Because flagging is also one of the assistant's actions, an agent's findings land here as flags too — with a note attached — so its conclusions become a reviewable set in your own view, not just text in a chat.
The record detail viewer
Below the table, the selected record's nodeLogs in colourised YAML — the ordered list of every
node that ran in that cycle and the values it logged.
- Click a nodeLog line to open that node's source at the method that ran (needs source roots).
- Click the event /
eventToStringline to jump the Source view to the processor's handler for the cycle. - Right-click anywhere on a node line to add any of its values to a graph — current, named, or new.
- Copy the shown record(s); toggle Wrap (off by default).
Search
The search box above the table is a full-text filter over eventToString, thread and the
node-logs (case-insensitive). It combines with the other filters. Enter remembers a term (dropdown +
inline autocomplete); Clear history empties the saved terms. On a memory-mapped multi-GB log a text
search reads records from disk, so it's slower than the index-backed dimension/time filters — the
assistant's aggregate/filter echoes report scan: index | raw so you know which happened.
The shared filter
One filter scopes every view at once — table, summary and graphs all honour it:
- Time range (top slider) — drag the two thumbs to bound
logTime; drag the middle to pan the selection keeping its width; double-click to reset. Shrink the visible window with the Window control (All / week / day / hours / minutes) and pan it across the whole log. - Event types (left rail) — tick the dimensions to keep (an OR). The list is split into Event types and Callbacks; use Select all / Select none, or right-click an entry for Only this / Add / Remove. Select none clears the view; leaving everything ticked means "all".
- Search — the text filter above.
Because there's one filter and one log, the assistant can drive these same controls — filter to a window, jump to a record, plot a series — and you see the result in the very views you're already reading. See the Assistant.
Summary
The Summary tab rolls the currently filtered records up by event dimension with counts, first/last times, span and rate. Right-click a summary row to filter the whole app by that dimension (Filter to / Add / Remove) — a fast way to drill in.
Diff
Select two records and Diff selected two records (Records menu or right-click) for a side-by-side comparison of the two cycles.
Each record is flattened to instanceId.key → value (last occurrence within the record wins) and the
two are aligned key-by-key. Every row is classified and colour-coded:
- changed — the key exists in both records with different values (highlighted),
- only A / only B — the key appears in just one of the two records,
- unchanged rows are shown plain, so the differences stand out.
A header reports the total difference count, and you can export the whole diff as CSV, JSON or PDF from the buttons along the bottom.
This is how you catch what moved between two cycles — e.g. a price, a quote id or an order state that
changed one propagation to the next — without eyeballing two raw blocks of nodeLogs.
Selecting a record also drives Topology & step-through: the nodes that fired in that cycle light up on the processor graph, in dispatch order.
Rolled log sets
A session that rolled across several files (maker.log, maker.log.1, … or date-stamped names) opens
as one log: opening any member offers the whole set. The load order comes from each file's
content — its first timed record — never from the name, because index suffixes are genuinely
ambiguous (logrotate's .1 is the newest rolled file; an incrementing writer's .1 is the oldest).
On load the analyser validates time order — within each file, and across the boundaries — and
reports what it finds ("maker.log.2 overlaps maker.log.1 by 3.2s", "17 records out of order,
first at record 3,412"). Violations are reported, never repaired: a backwards timestamp is a
finding (a clock step, a mis-merge), and re-sorting records would destroy the evidence. While a
violation exists, time-anchored answers (at, rolling windows, buckets) carry a caveat note; record
anchors are unaffected. Agents open an explicit set with open {logs: [...]} and read the same
report from context.
Confirming correct behavior
A finding can confirm expected behavior. Use flag with kind: "confirmation", a note stating the
observation and an optional fix carrying your assessment. These appear as Observation / Assessment
in the table tooltip, topology callout and reports, including PDF. The record's context menu offers the
same category choice when writing a finding. Existing findings default to fault; omitting kind while
editing a finding preserves its category and any omitted text.
Flags and finding categories are included in the local session-recovery snapshot. Closing and reopening a project offers restoration explicitly; findings are restored only against the verified unchanged log. They are commentary about the records, not additional runtime evidence.