Fluxtion Audit Log Analyser
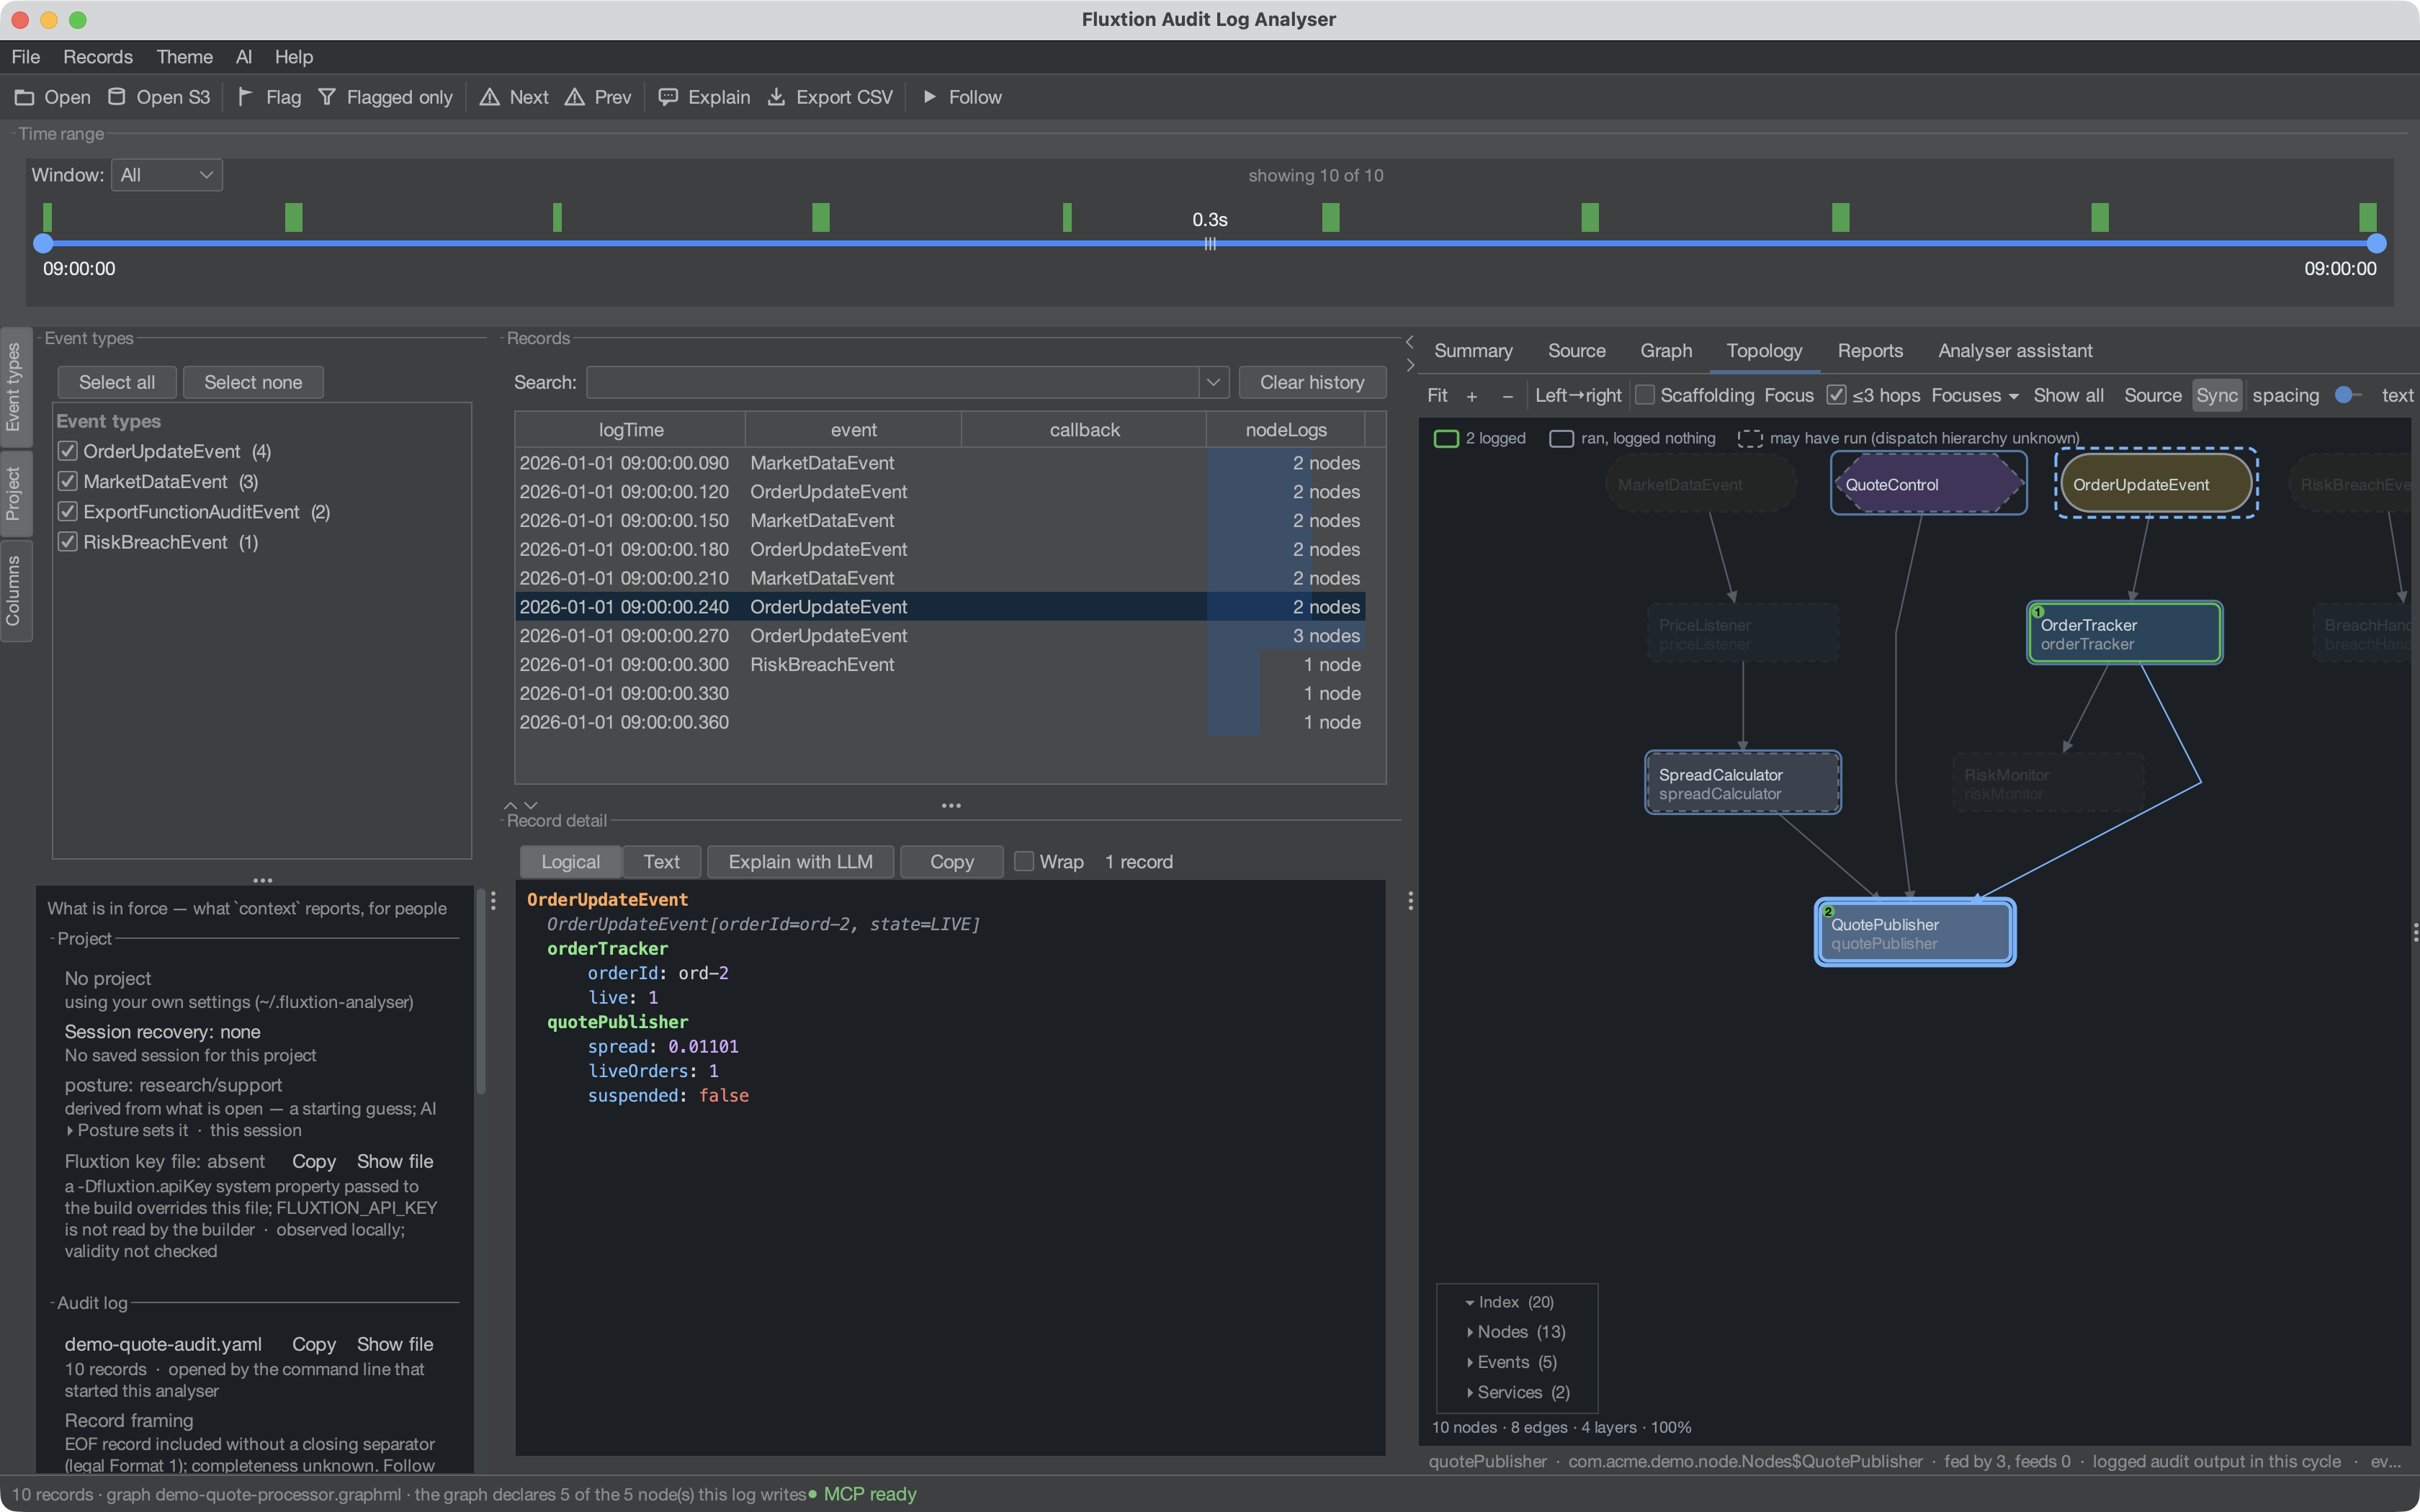
A fast desktop tool for Fluxtion event-audit logs — browse, filter, graph and explain the event
history of a Mongoose/Fluxtion EventProcessor. Index-first, so it stays responsive on multi-GB logs.
The processor already writes down everything it does. The analyser is what makes that record answer questions — in minutes, with evidence — whether it's you asking or an AI.
You do not have to have written the system. That is the point most easily missed: the log is not anyone's account of what happened, it is what the processor emitted as it ran. So it answers to a support engineer on their first week as readily as to the person who built the graph — which is why teams report questions that took hours being answered in minutes by people who were not there when it happened. See Answering questions about a running system.
Run it now
No build needed — just JDK 21+. No log to hand is fine: the analyser opens on a page whose first button loads a recorded run and its topology from inside the jar. With JBang:
Or download the latest fatjar and run it:
curl -LO https://github.com/telaminai/fluxtionauditlog-analyser/releases/latest/download/fluxtion-auditlog-analyser.jar
java -jar fluxtion-auditlog-analyser.jar
See Install & run for details.
What it does
Building a system with an LLM? The illustrated Spring authoring path takes you from a design conversation to a Java project, then brings the run back into the analyser. The LLM renders evidence, charts and reports on a canvas you can both inspect and question.
One source of truth, a whole toolchain. The analyser takes the Fluxtion event-audit log — a deterministic, replayable record of every propagation cycle — and feeds it through one connected toolchain to explain, drill down, observe, graph, monitor, interrogate and fix, in a fraction of the time that reading raw logs normally takes. Every feature below is a lens on that same log.
- Fast on big logs — a compact columnar index keeps browse/filter/summarise responsive; files above a threshold are memory-mapped rather than loaded into heap.
- Graph any node value over time — stairs/line/points, booleans as ±1, zoom/pan, multiple graphs,
CSV/PNG export, and derived formula series (
f(x)). See Graphs. - Explain — and let the assistant drive the analyser. Ask Claude/OpenAI what happened; it can plot the offending series, flag the culprit records and filter the view so you see the fault — over the same data you can click into and verify. No key? It copies a prompt that lets any agent drive the analyser too. See Assistant.
- Log → source navigation — click a node line to open the exact class/method. See Source navigation.
- Share your setup — export/import roots, event processors and named graphs to a file. See Sharing setups.
Why it matters
- Minutes to root cause, not hours. A production incident in an event-driven system normally means grepping a multi-GB log and reconstructing what fired, in what order, by hand. Here the log is indexed in seconds, anomalies are pre-tinted, any value graphs over time, two cycles diff in a click, and any log line opens the exact source method that wrote it. The answer comes with evidence, not a plausible story.
- The audit log becomes an asset, not a storage cost. You already produce and retain these logs. With the analyser the same bytes are incident forensics (what actually executed, with state), a compliance answer (prove why this order was amended — replayable, per-cycle, traceable to source), and a shared team artifact — export your setup so everyone investigates from the same roots, graphs and formulas.
- It answers to someone who did not build it. Diagnosing an unfamiliar system normally means finding the person who knows it, and waiting. Here the system explains itself: every cycle names the nodes that ran, in order, with what each computed, and each one opens the source that wrote it. The knowledge you would otherwise have to borrow from an author is in the record — which makes this as much a support tool as a development one.
- Only possible here. A Fluxtion processor is deterministic and its graph is generated from source — so a record isn't just a log line, it's a replayable trace with a code address. That's what lets the analyser (and the assistant) explain why, not just what.
Agentic fault-finding — the assistant drives the tool
The feature to see first. Point the assistant at a suspicious window and it investigates inside the analyser: it reads the surrounding records, aggregates over the columnar index, then renders its conclusion as a view you can interrogate — a captioned graph of the offending series, the culprit records flagged, the table filtered down to them. Its answer is a chart and a set of records, not a wall of text you have to trust. The verification loop is built in: click a plotted point, jump to a flagged record, trace it to the exact source method.
No API key needed — and it works with any agent
Hit Copy prompt and the analyser hands you a self-contained brief — the evidence plus its action protocol (localhost endpoint, token, verbs). Claude Code, Claude Desktop or any agent can then drive the analyser back: seek more records, aggregate, and plot the fault for you to see.
See the Assistant guide for the full workflow.
Connect your own AI client
The Start page has Connect Codex, Connect Claude and Generic MCP setup cards. They take you to the live-session setup screen, where you enable the local transport, test the exact bridge command, and either explicitly register a supported CLI client or copy the generic no-token JSON. See Connecting an LLM to the analyser.
Get going
- Getting started — open a log, add source roots, pick your event processor, configure the LLM, S3 and tailing — everything in Settings to get up and running.
- From playground to analyser in 10 minutes — download a runnable system, start it, and read the log it produces. A JDK, no API key, nothing else to install.
- Install & run
- User guide
- Log format
- FAQ
- Release notes