From playground to analyser in 10 minutes
Download a runnable event-processing system, inspect its graph, run it, and let the analyser show what the compiled processor actually did — on your machine, with code you can edit.
You need a JDK 21+. The project builds and runs with no Fluxtion API key because its generated
processor is committed. On a machine without Maven, the wrapper's first download also needs curl or
wget. A key is needed only when you deliberately regenerate after changing the graph.
1. Download the analyser bundle
Open the playground's template gallery, choose Audit analyser bundle, click Open starter, then Download ZIP in the starter.
Or get the same bundle without leaving the analyser. File ▸ New project from template… reads the playground's live catalogue, shows each template's description and whether it needs a build key before anything is downloaded, and unpacks the one you choose into a new or empty directory. The generated project's profile becomes the active project, so the first action of step 2 (Open project…) is already done when it finishes; opening the GraphML is still yours to do, for the reason step 2 gives.
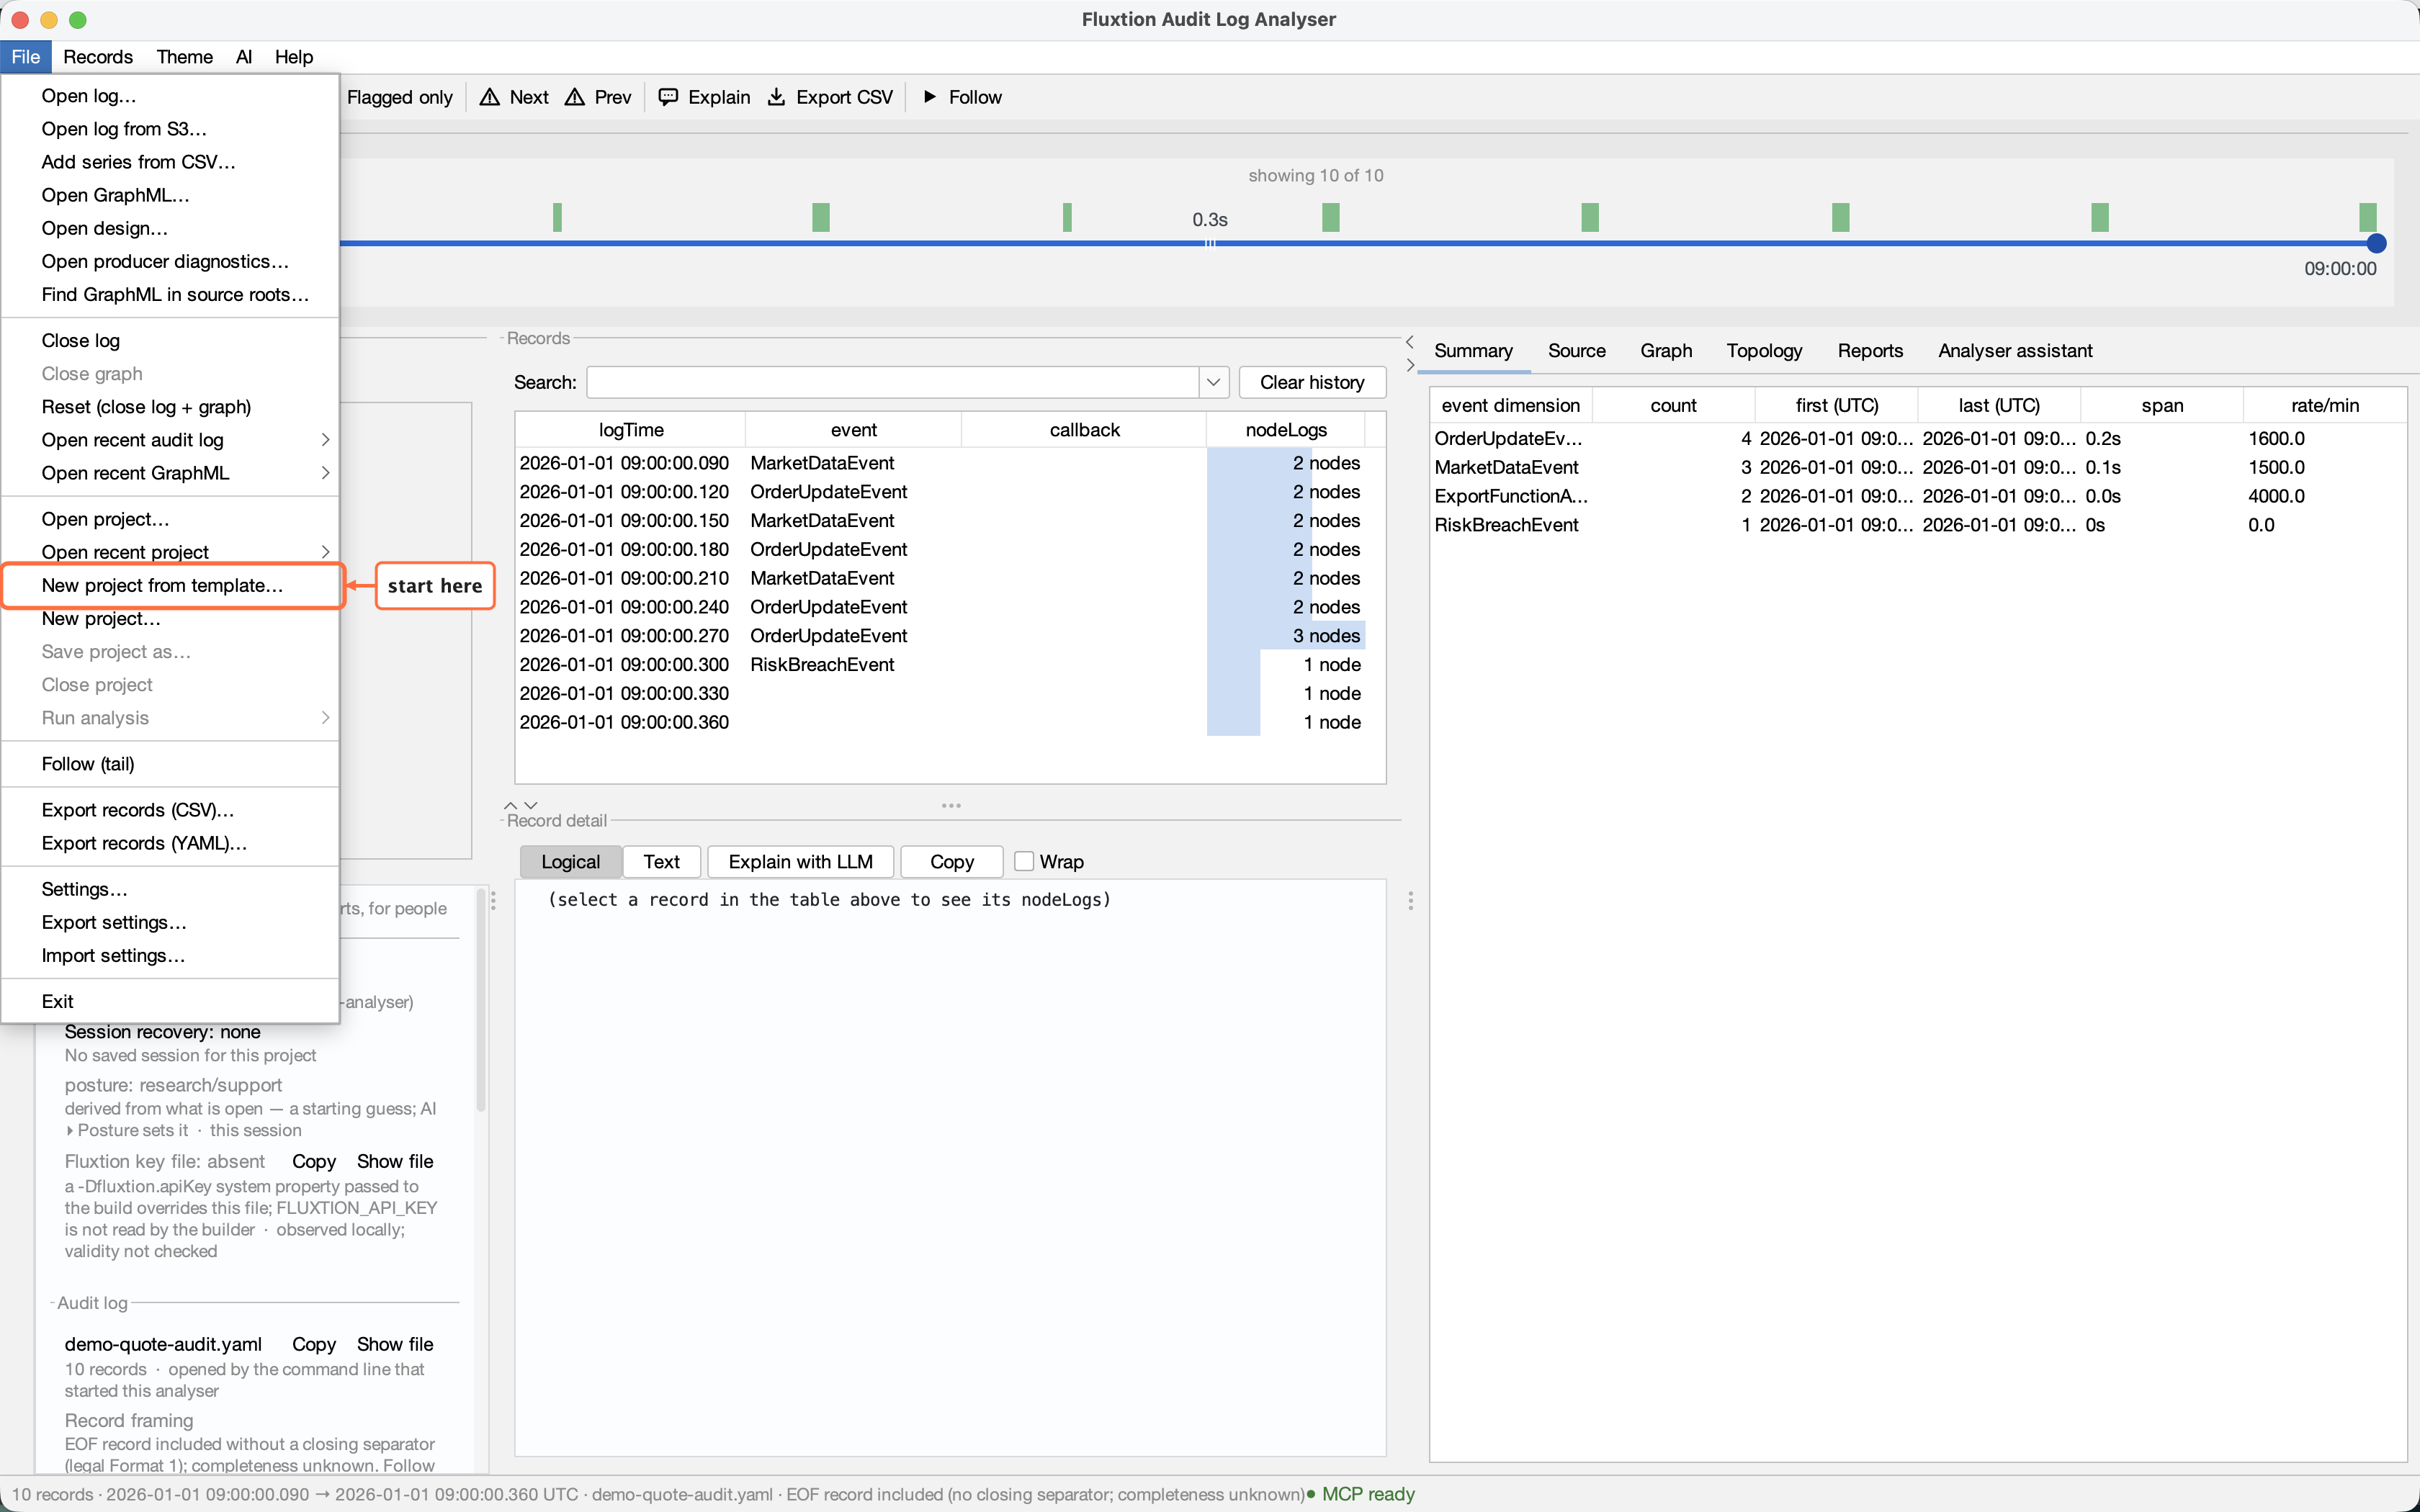
In the picker, ① choose Audit analyser bundle — note Build key: none required under it — then ② Use this template, and pick a new or empty directory when asked.
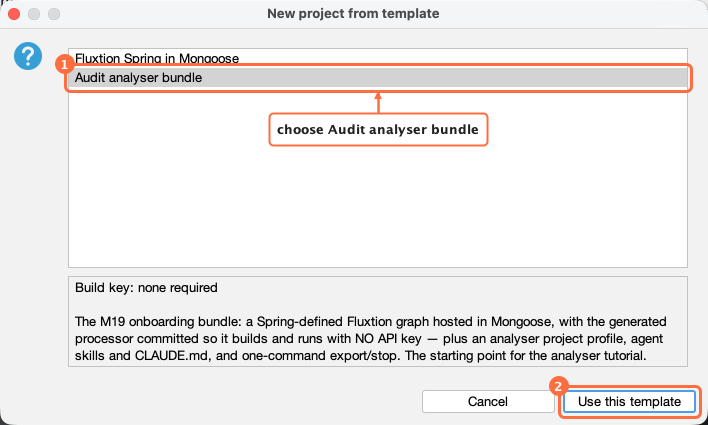
The orange marks are added by the documentation build to show where to click — they are not something the analyser draws. (Its own spotlight, which an AI assistant uses to point during the tour in step 5, dims the window and tags its callouts assistant; it covers the main window, not menus or dialogs.)
The analyser does not run downloaded code: when the project is ready it shows the build, run, export and stop commands for you to copy, and you decide whether to paste them into a terminal. Either route gives you the same directory; Projects ▸ Start from a playground template has the details of what the download will and will not do.
This is a complete Maven project, not a prebuilt application you cannot inspect:
| Path | What it is |
|---|---|
src/main/fluxtion/designer/application-context.xml |
the graph definition — nodes as beans, edges as constructor arguments |
src/main/java/com/example/myapp/generated/MarketProcessor.java |
the committed generated processor, which makes the ordinary build keyless |
src/main/resources/com/example/myapp/generated/MarketProcessor.graphml |
the exact topology emitted with that processor |
config/server-config.yml |
the Mongoose deployment: feed → processor → sink, with Chronicle audit capture |
.analyser/project.fluxtion-settings |
portable analyser context: source root, processor and runbook pointers |
.claude/skills/ |
this project's procedures, written for an AI assistant: run/export/stop the server, load the log, add a node — and guided-start, a tour of the analyser (step 5) |
CLAUDE.md / AGENTS.md |
the context an IDE agent receives when it opens the project |
2. Inspect the graph before it runs
Start the analyser:
That command needs JBang. The install page also gives the
plain java -jar route.
In the analyser:
- Choose File ▸ Open project… and select the
audit-analyser-bundledirectory. - Choose File ▸ Open GraphML… and select
src/main/resources/com/example/myapp/generated/MarketProcessor.graphml.
Opening the project loads its portable context, but deliberately does not guess which file you want to inspect. Opening the GraphML is therefore an explicit second action. With no log yet, the Project panel shows the source root, event processor and shipped runbooks that are already in force.
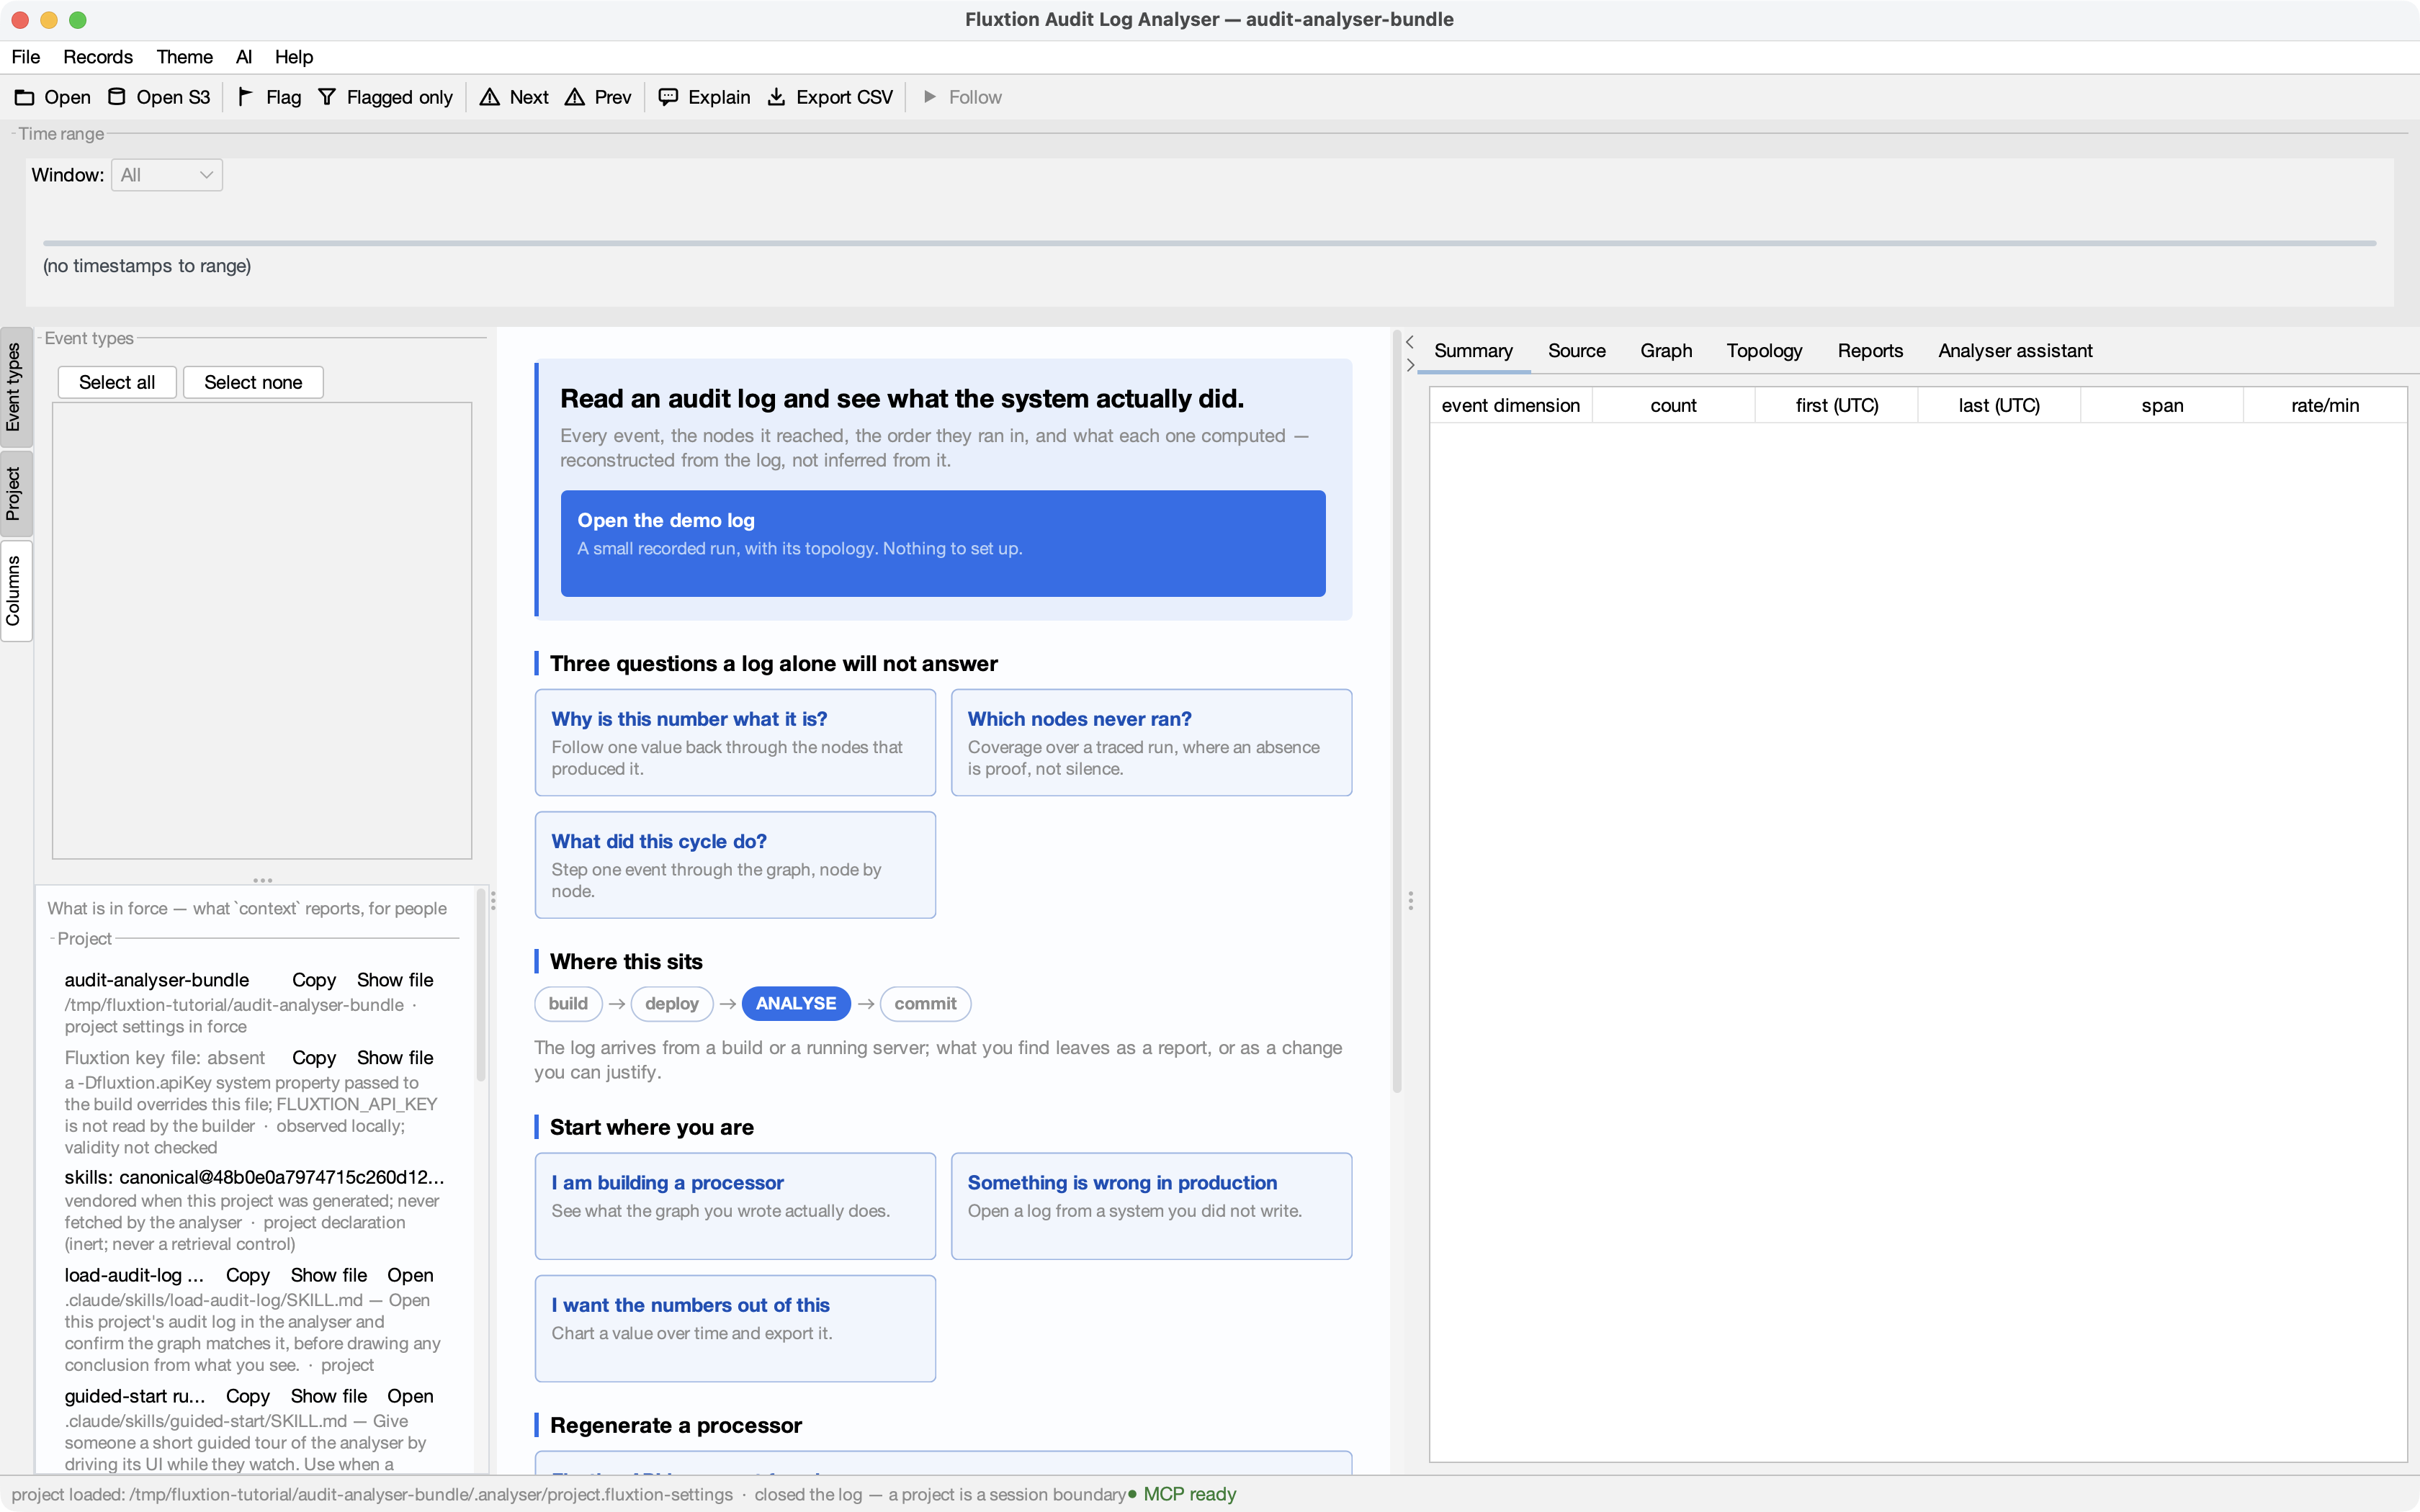
3. Run, export and stop
Start the server in one terminal:
It reads data/input.txt, dispatches five typed PriceEvent cycles through MarketProcessor, and
captures the cycles in Chronicle. While it is up it publishes
~/.mongoose/servers/audit-analyser-bundle, which is how the other lifecycle commands find the exact
server without a copied URL or token.
In another terminal:
./export-audit.sh     # writes logs/audit-audit-analyser-bundle.yaml
./stop-server.sh      # waits for process exit and registry removal
Export is a separate step because Chronicle capture and analyser-readable YAML are different formats. The stop helper verifies the Java process and this project's exact jar before signalling it; success means it observed both the process and registry entry disappear.
4. Read the exported run
Return to the analyser and choose File ▸ Open log…, then select
logs/audit-audit-analyser-bundle.yaml. If you restarted the analyser, open the project, GraphML and
log as three separate actions in that order: a project switch is a session boundary and intentionally
closes any previous log and graph.
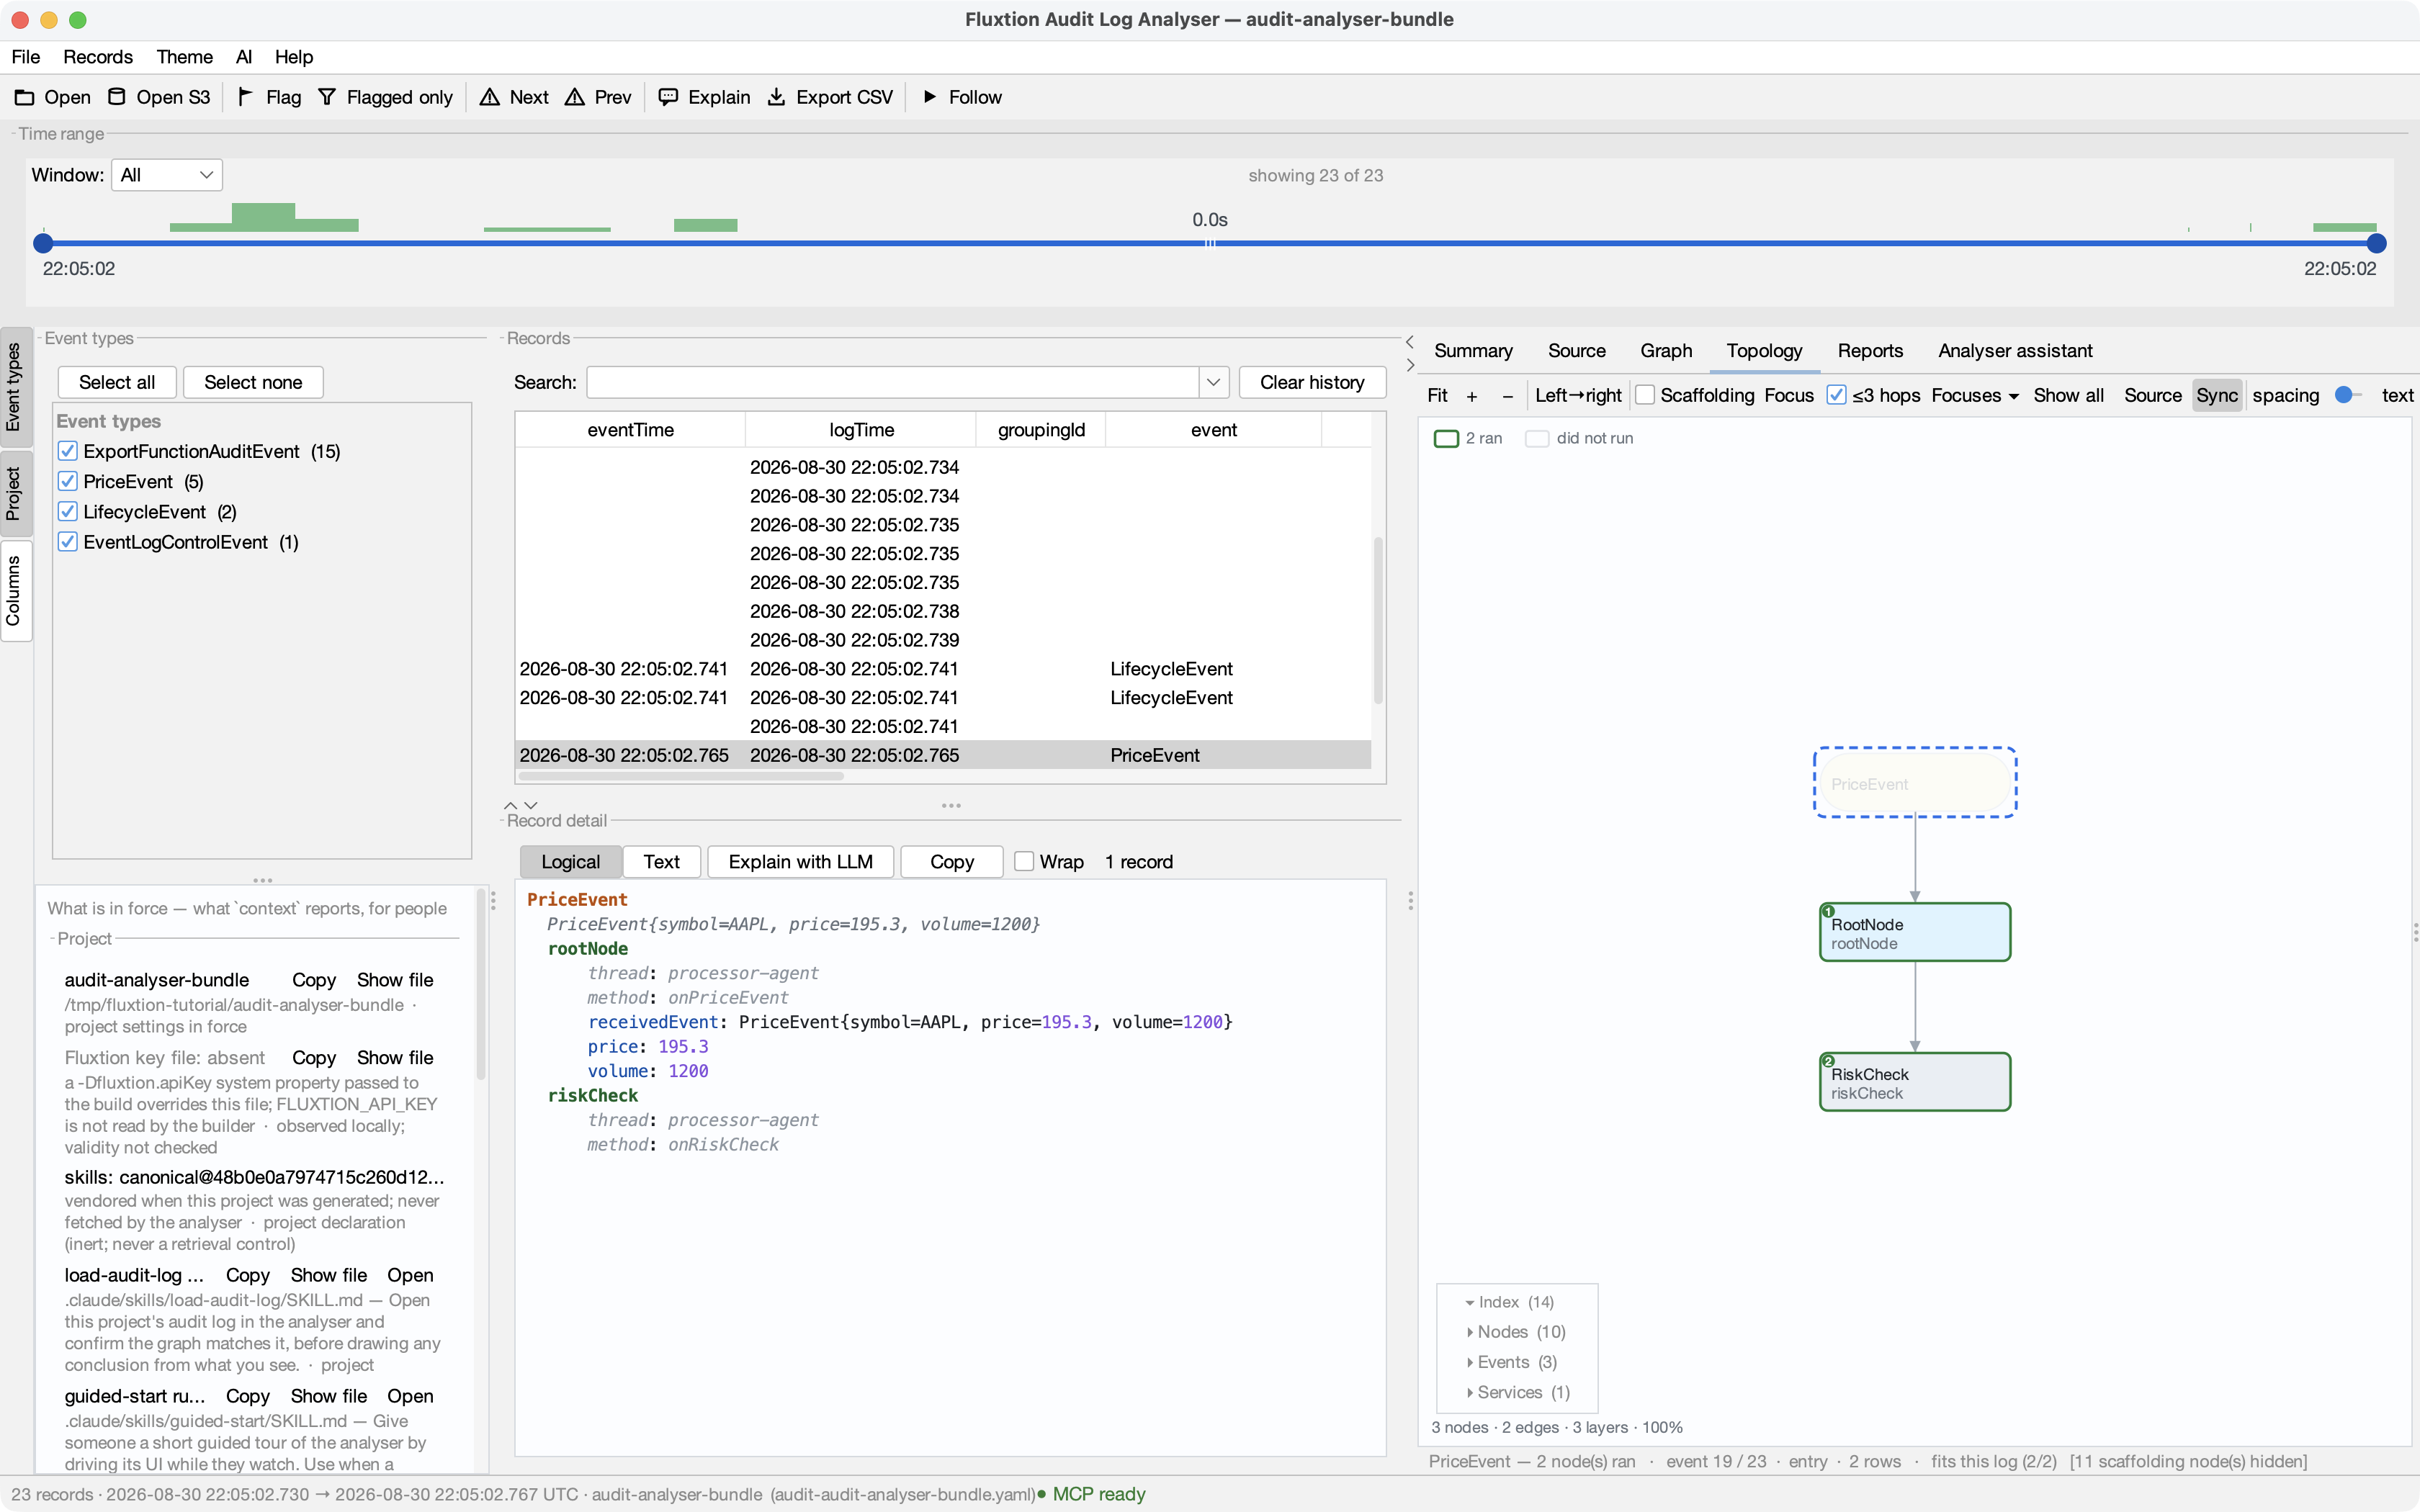
The analyser now shows 23 records, the event types it found and whether the graph actually fits the log. The screenshots in this section were generated from the real bundle staged under a neutral path.
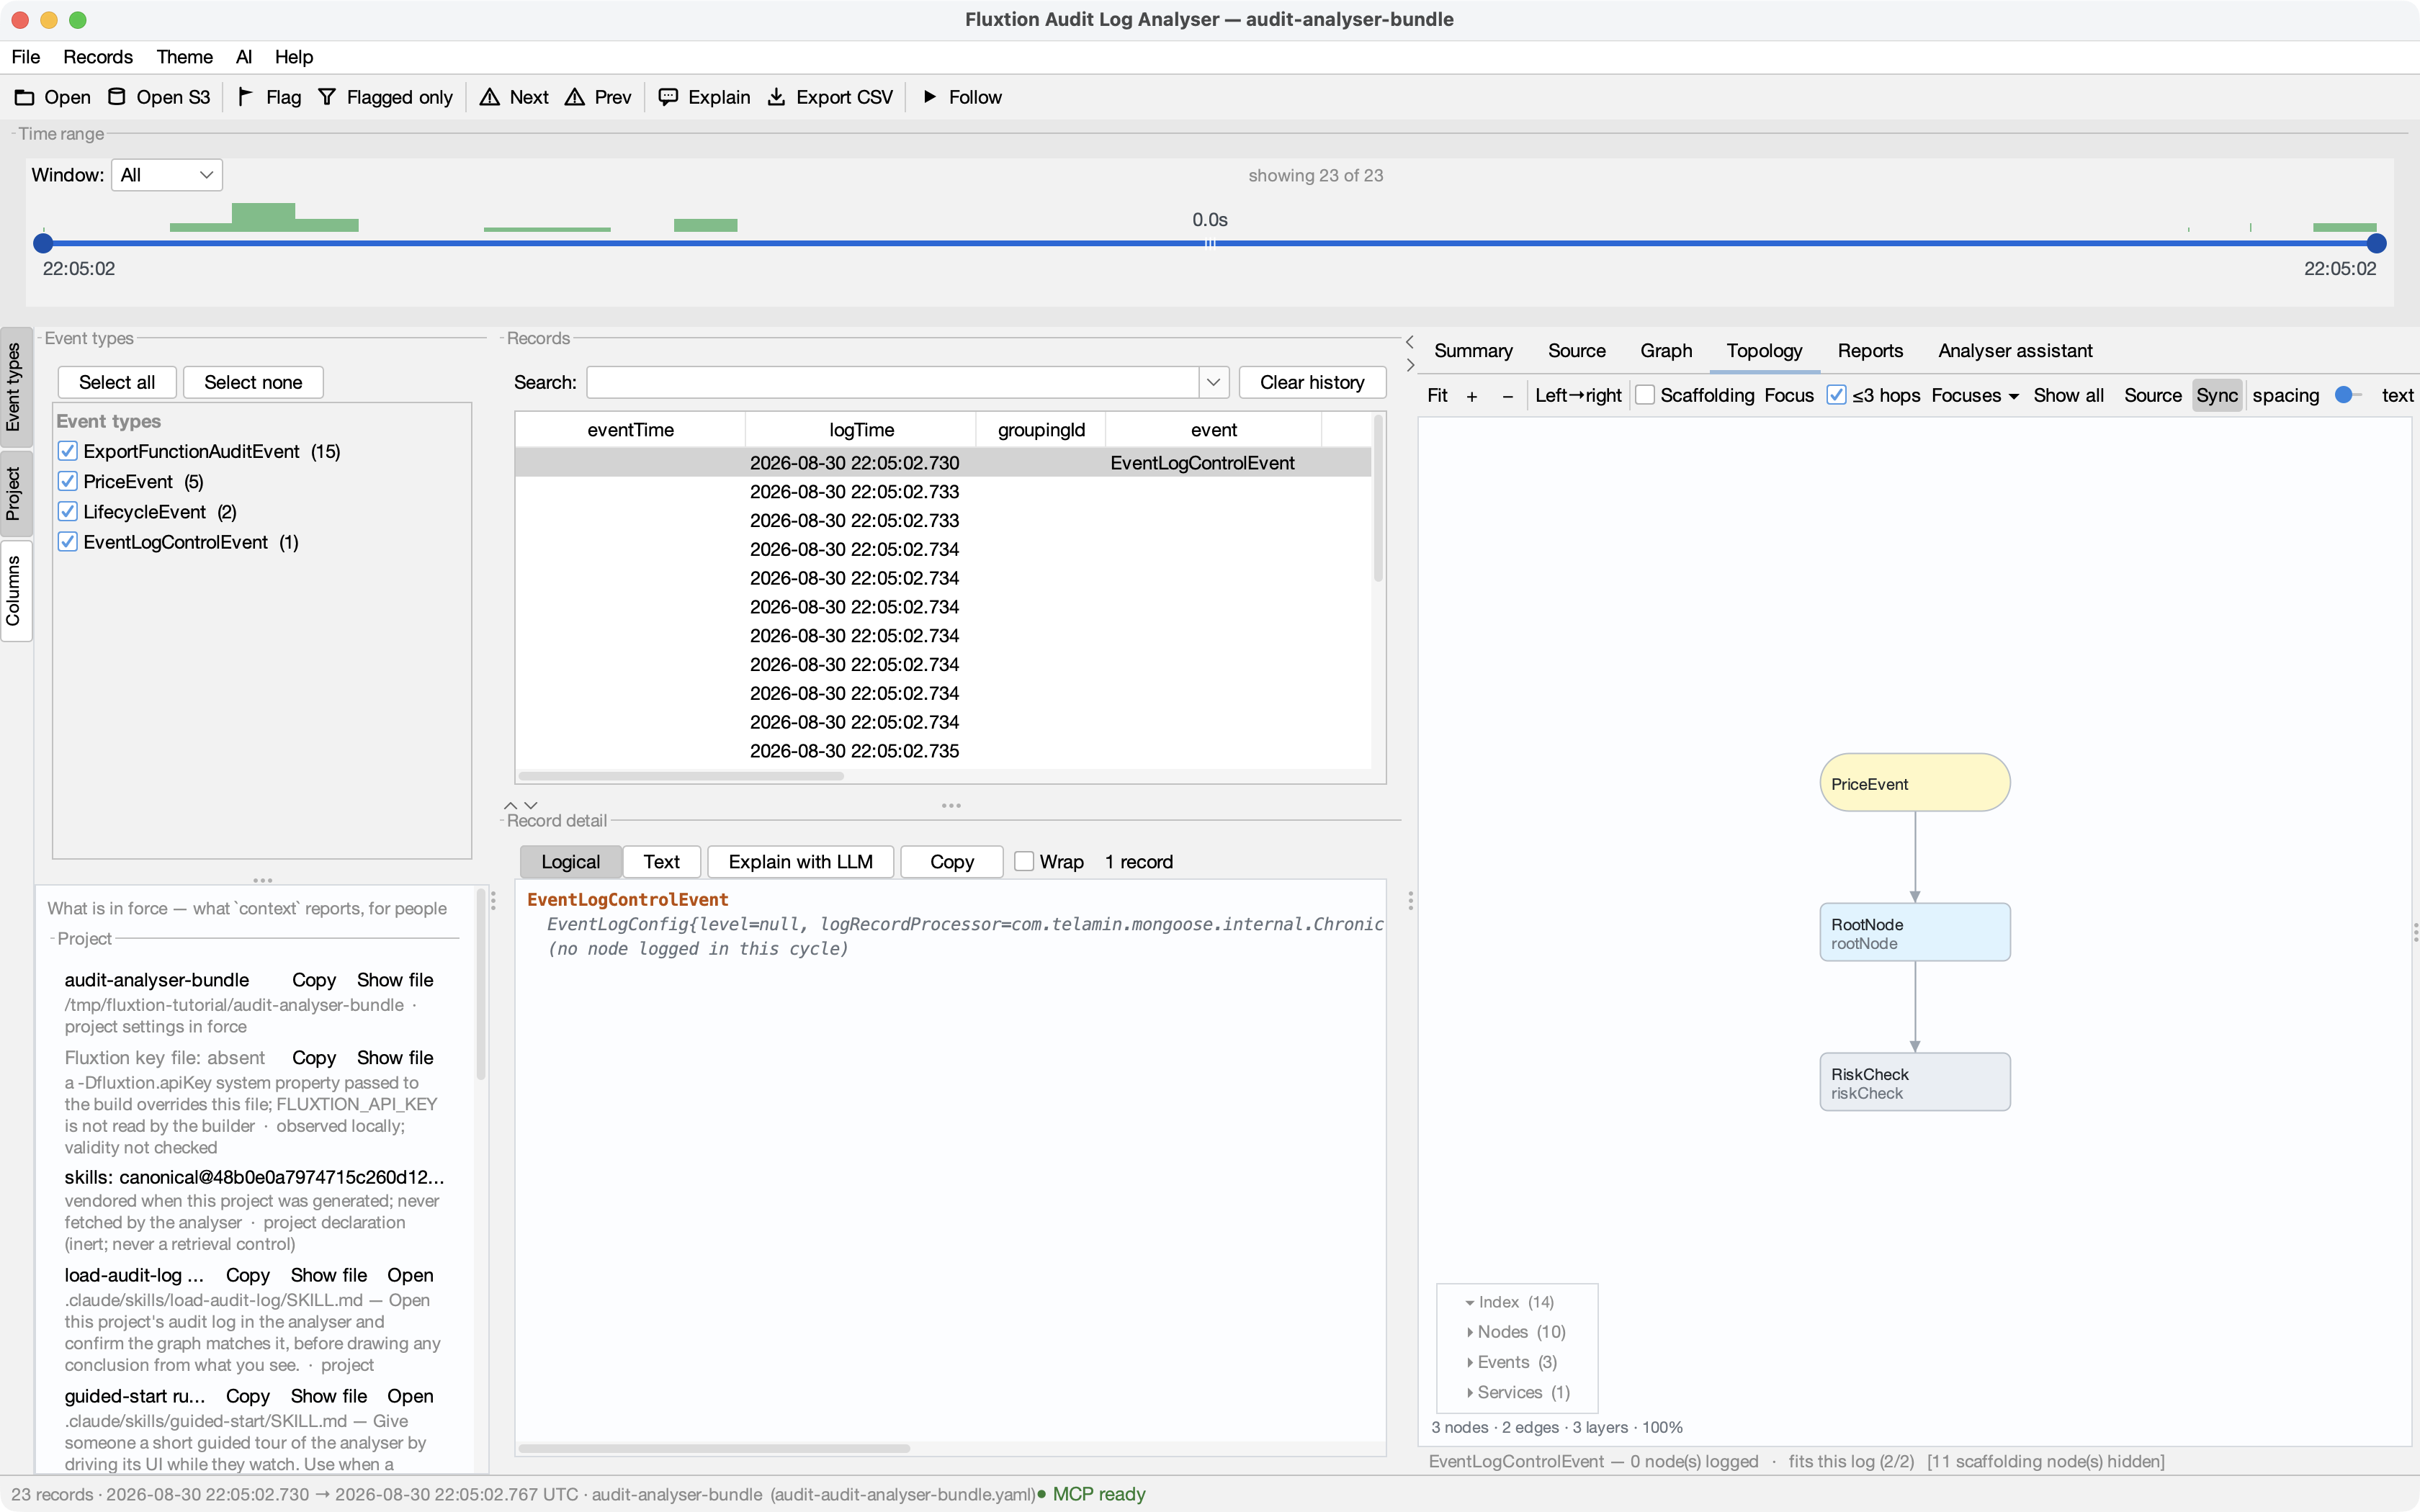
Try these in order:
- Select PriceEvent in the Event types panel to remove lifecycle and control records from the view.
- Select a cycle and read
rootNodefollowed byriskCheckin the logical detail. That is the processor's recorded dispatch order for the cycle. - Check the pairing statement before treating an absent node as meaningful.
- Click a node log, then use Source to open the generated processor and node method that produced it.
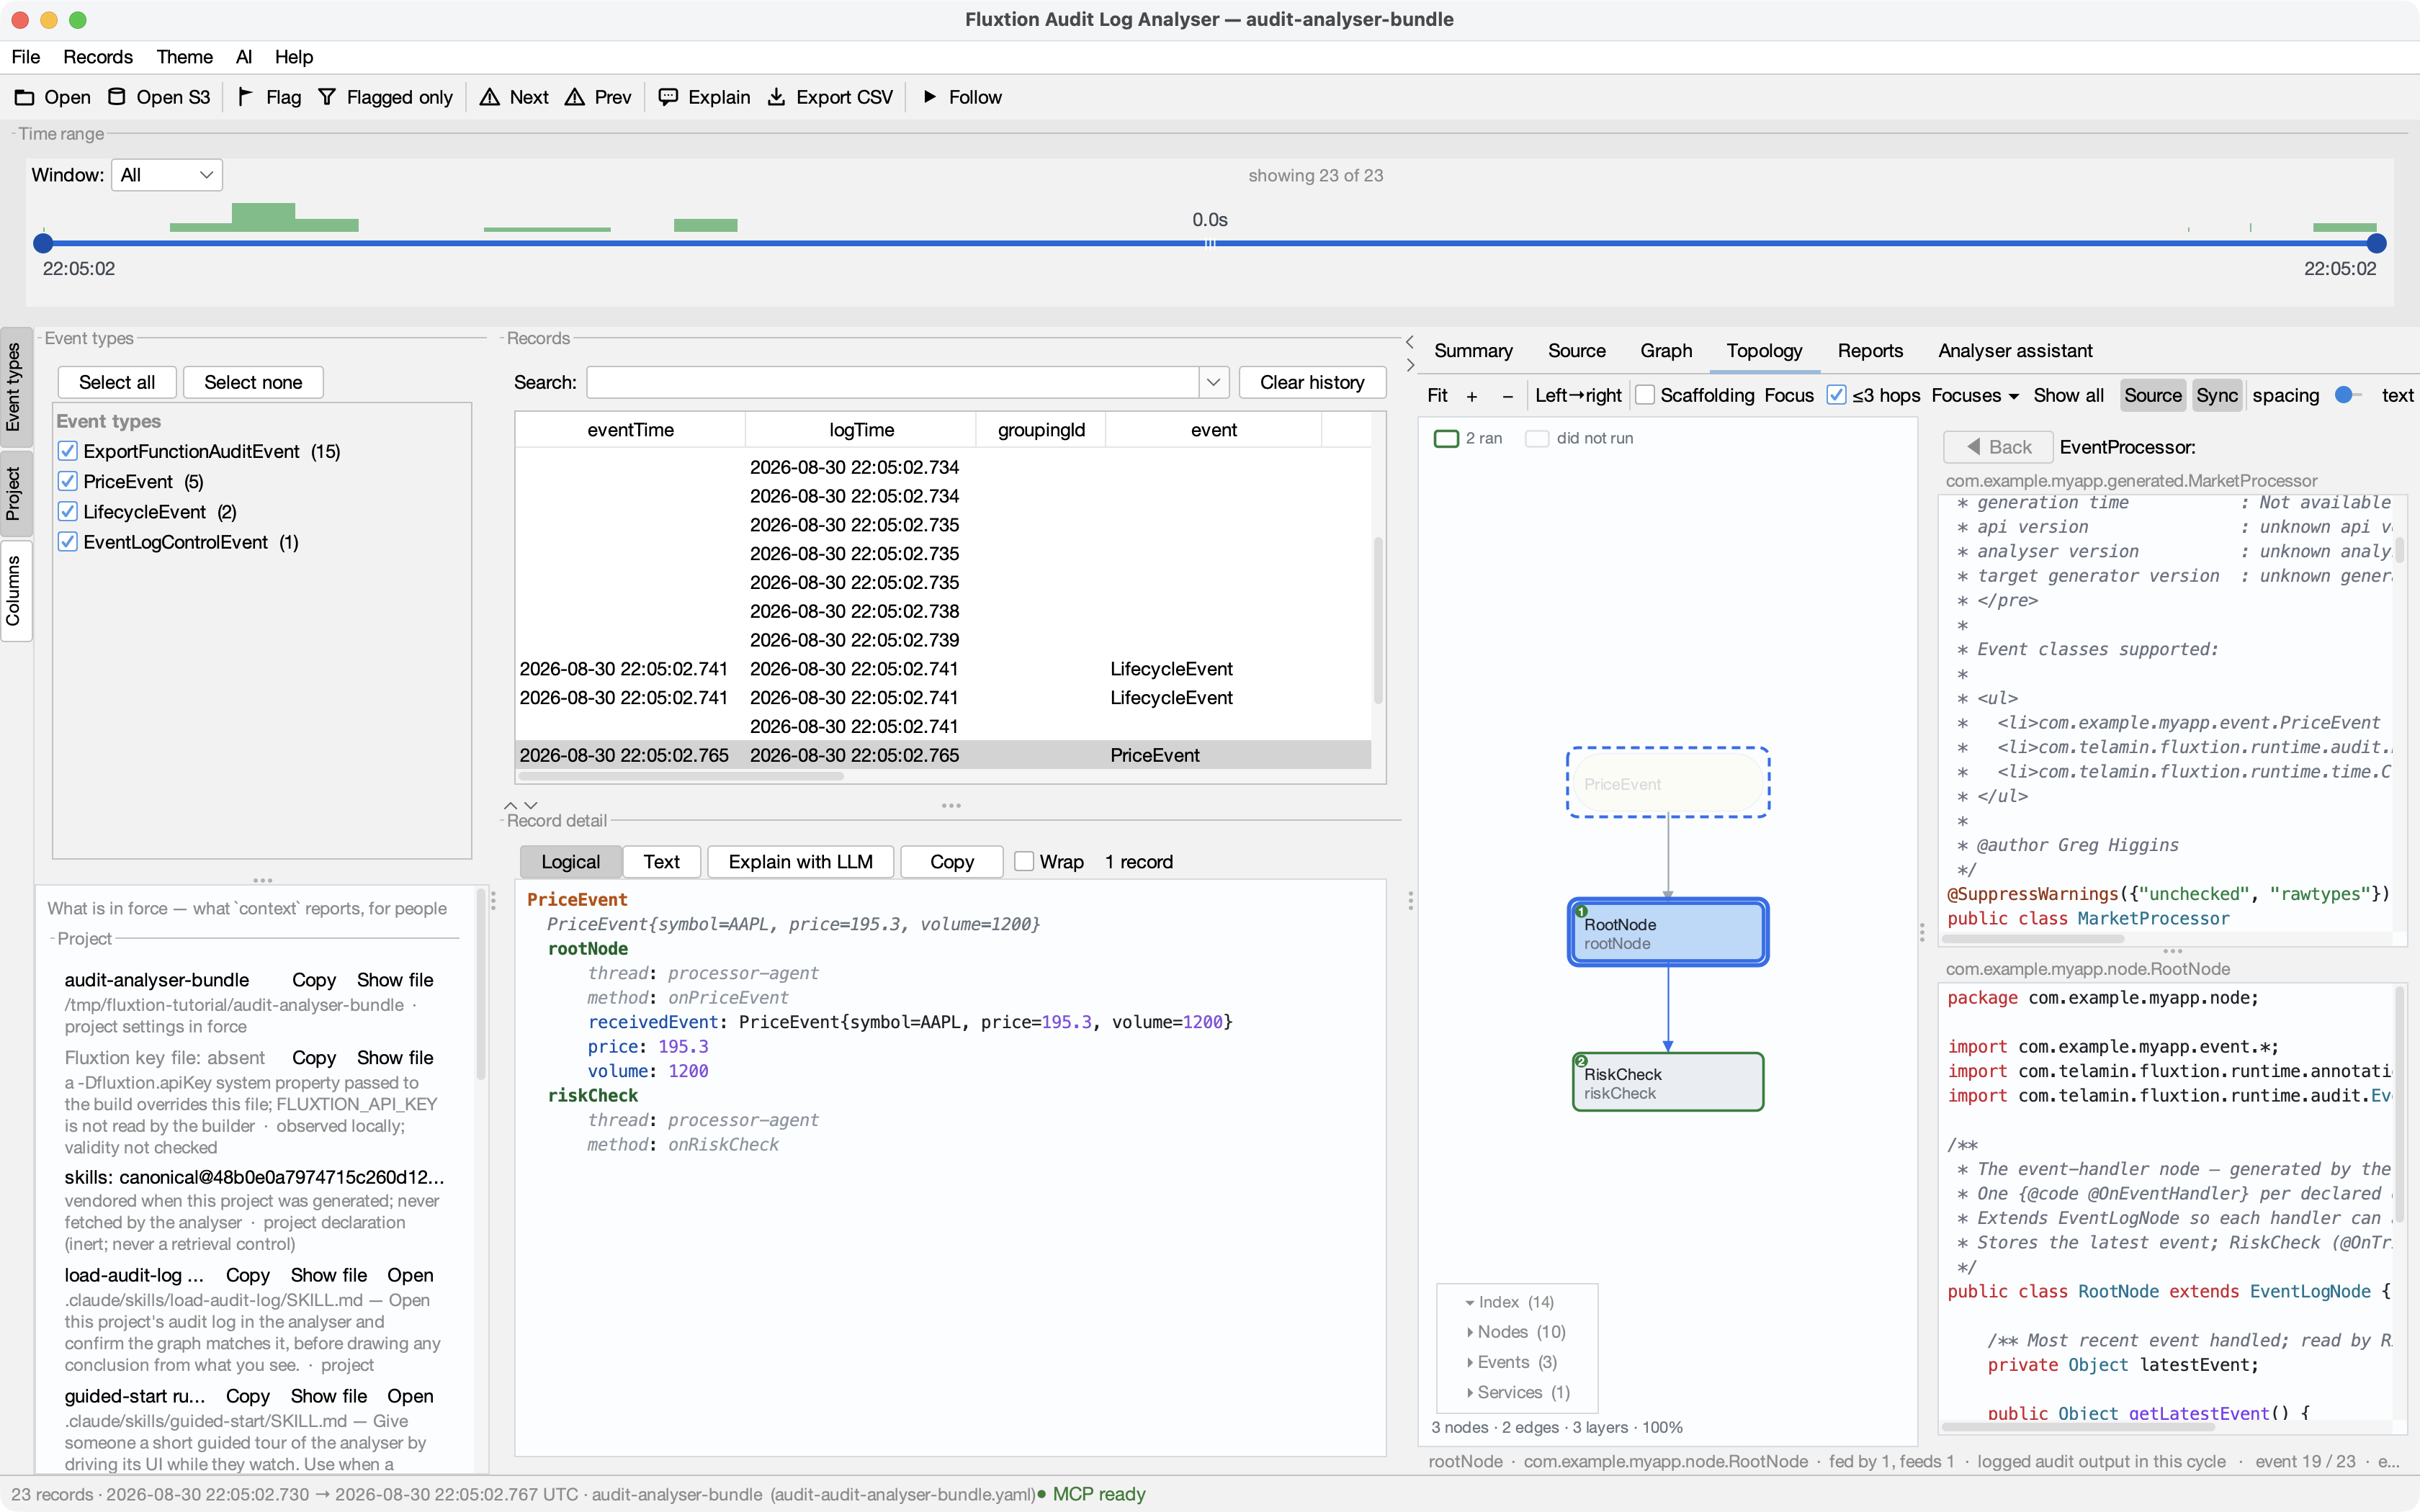
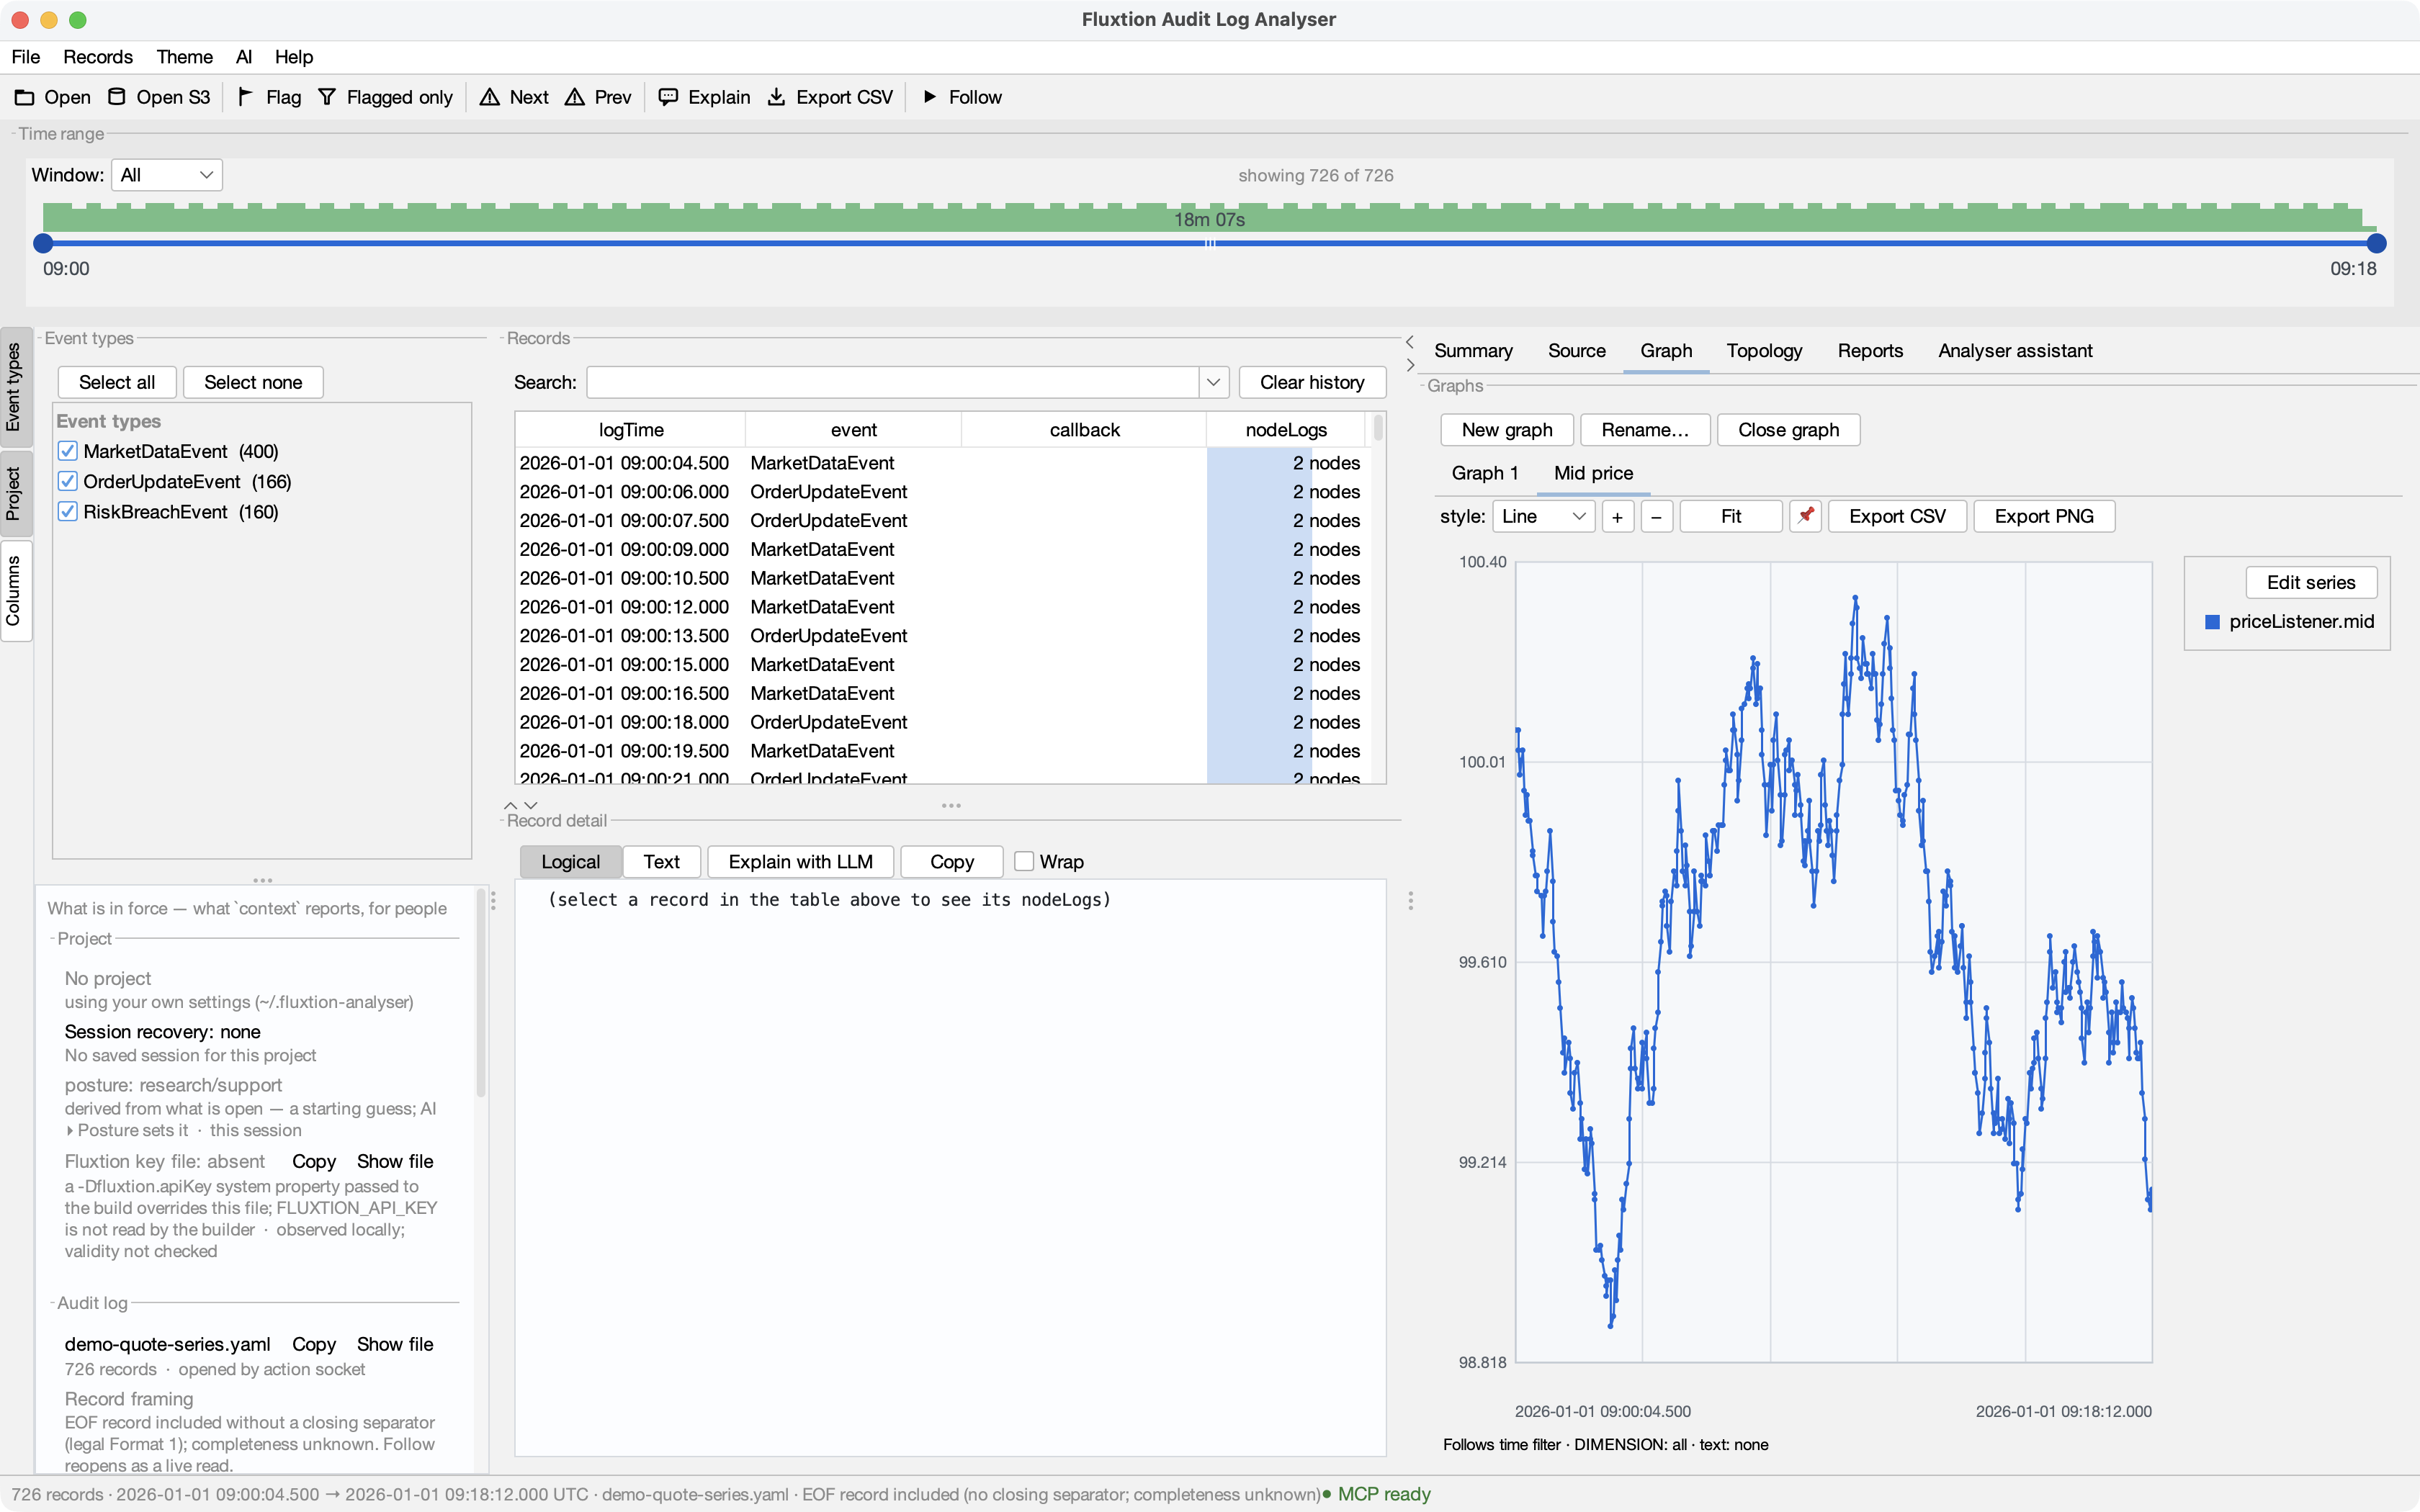
The analyser can graph any numeric node-log value, and this bundle now writes two. Alongside the
readable rootNode.receivedEvent, each cycle records price and volume as their own numeric keys —
visible in the record above. Right-click either one and chart it: a string entry is for reading, a
numeric one is for measuring, and a series needs the second kind.
The bundle's own run is only five cycles, so the chart is a short one. The screenshot below is the same action over the analyser's longer anonymous DEMO run, purely so the shape is legible.
This exported YAML is a fixed snapshot, so do not turn on Follow and expect Chronicle events to appear in it. Follow is for a local YAML log that another process is appending to. For this bundle, export again after another run and reopen the resulting snapshot.
5. Ask an AI, then verify what it shows
Select one or more records and click Explain. With an LLM provider configured, the in-app assistant can read around the selection and render findings back into the analyser as filters, flags and graphs. Without a provider key, Copy prompt gives the same evidence and action protocol to another agent.
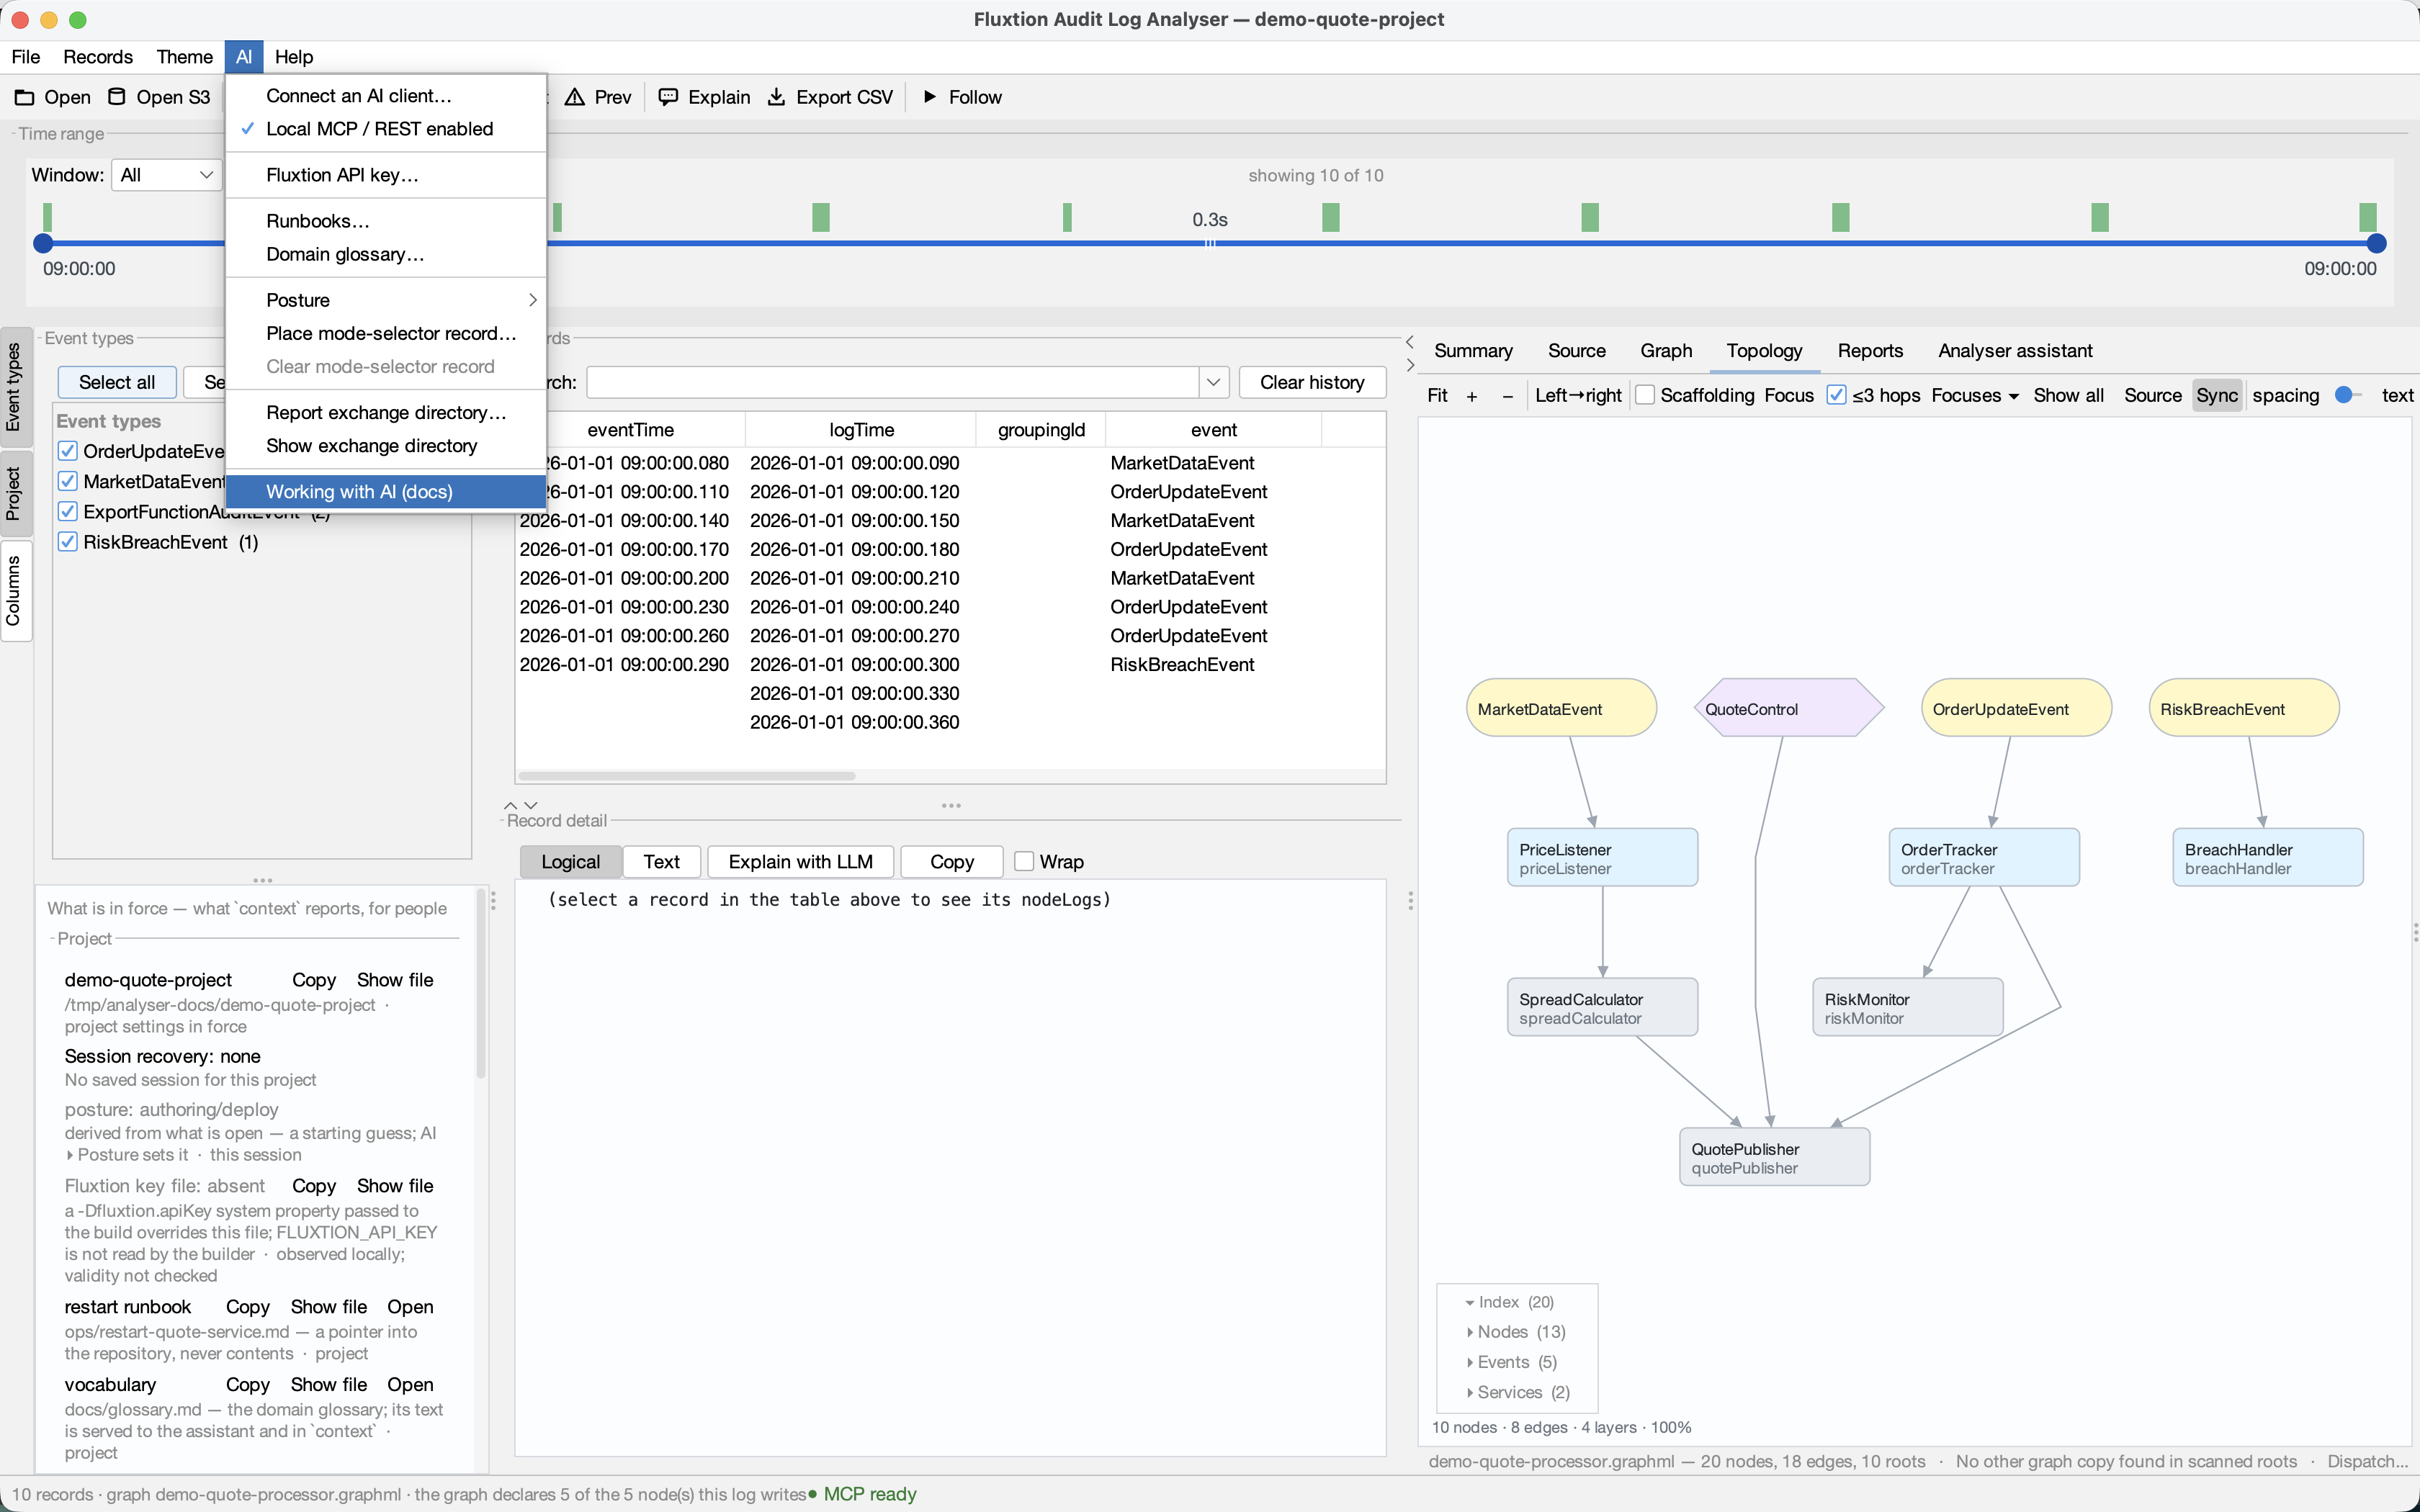
To let an MCP client work in this analyser window, use AI ▸ Connect an AI client…. The dialog resolves the launcher for this installation and provides the exact client record; do not reconstruct a hard-coded command from this tutorial.
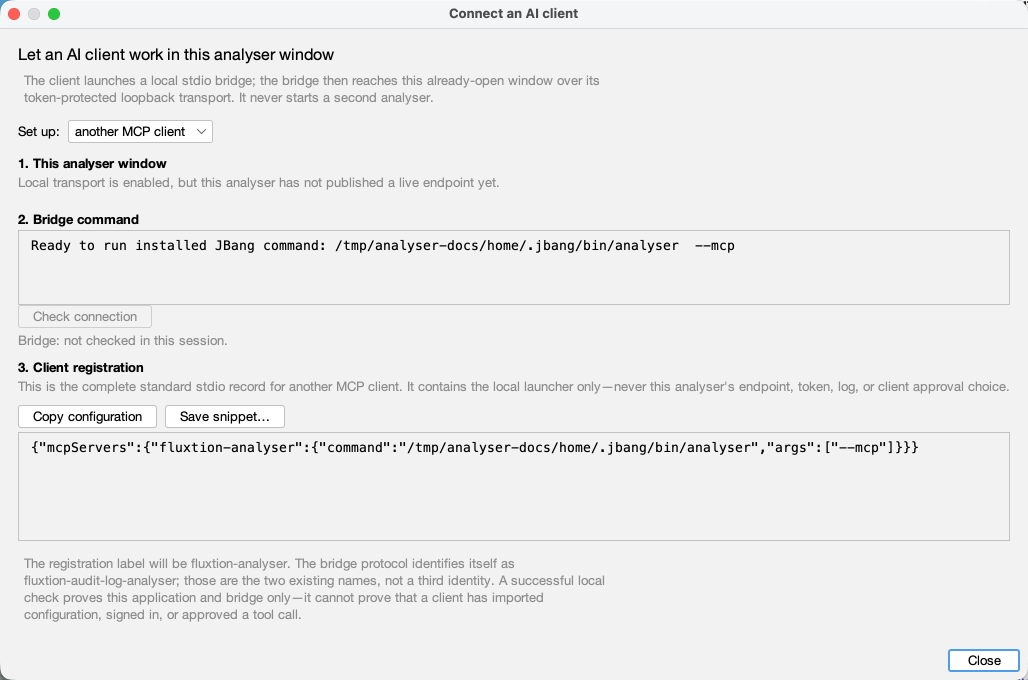
Would you rather be shown than read steps 2–4? The bundle declares a runbook for that. Once your client is connected, say:
You do not need to tell it how. The project's profile points at .claude/skills/guided-start/SKILL.md, the
analyser lists it among the project's runbooks in context, and the assistant reads it from your checkout — the
analyser stores no instructions and runs nothing. The tour drives the window while you watch: what ran and in
what order, which declared nodes never logged, and one question answered and bookmarked. Its one rule is that it
points rather than tells — every figure is one you read off the screen yourself — and with analyser 1.14 or
later it points literally, dimming the window and lighting the thing it is about to talk about.
This is the one step that needs an AI client connected to the analyser (the dialog above). Without one, nothing is lost: steps 2–4 are the same tour by hand, and the Start page's own actions open the demo set.
The useful division of labour is strict: the analyser reads evidence and changes its own views; your IDE agent edits code. After any explanation, click the plotted point or flagged record and follow it back to the audit cycle and source.
6. Change the processor
Open the Maven project in your IDE. Its CLAUDE.md, matching AGENTS.md, vendored skills and Spring
authoring snapshot tell the IDE agent how this particular graph is defined and how to run it. Change a
node class, or edit application-context.xml to change the graph itself.
Regeneration is the one keyed step:
Put the key in ~/.fluxtion/fluxtion.apiKeyFile as apiKey=…, or pass
-Dfluxtion.apiKey=… to that build. The compiler does not read FLUXTION_API_KEY, so exporting
that variable alone cannot satisfy regeneration. The ordinary build and run remain keyless.
Reopen the exported YAML and examine the new cycles. The analyser has one active log at a time; it does not yet compare two complete runs side by side, so this tutorial does not promise that future diff tool.
Do this on your own system
The bundle is a demonstration; the point is your processor:
- Produce a log from your own processor.
- Open a project for your repository. File ▸ New project… offers
source roots, skill-shaped runbooks and GraphML it finds, and adopts only what you confirm — plus an
unchecked option to create a
CLAUDE.mdpointing at the canonical Fluxtion authoring docs, which is the one choice there that writes a file rather than recording a pointer.
The bundle exists so you can see the complete evidence loop work once before pointing it at something that matters.