Analyser assistant
The assistant assembles the selected record(s), the node-type map and the relevant source, then asks a model to explain what happened in the cycle and why.
Its real power is the round trip. The assistant doesn't just answer in a chat window — it can drive the analyser and file its findings back as things you can see and interrogate: a plotted graph, a filtered table, jumped-to and flagged records, all over the same data you can click into and trace to source. The conclusion arrives as a chart, not a wall of text you have to trust — so the verification loop is built in. When the assistant says "the quote calculator stopped because the venue disconnected here", it can plot that series and flag those cycles, and you watch it on screen.
Fault-finding in practice
- Scope it. Drag the Time range window to the incident, then select the suspicious records in the table (Shift/⌘-click for several).
- Ask. Right-click ▸ Explain selected with LLM, or use Explain with LLM in the record detail.
- Watch it work. The assistant reads the surrounding records, aggregates over the index to spot the pattern, and when it finds the cause it plots the offending series into a graph (captioned with its reasoning), flags the culprit records, and filters the table down to them — the fault rendered in your own instrument, not described in prose.
- Verify. Click the plotted points, jump to the flagged records, trace a nodeLog line to the exact source method. Nothing is taken on faith; the evidence is right there to challenge.
No API key? Copy-prompt mode
No key, or working in a different agent (Claude Code, Claude Desktop)? Hit Copy prompt. The copied prompt is a complete, self-contained brief: the selected records, the node-type map, the relevant source, and the log's file path, shape and per-record byte offsets — plus the analyser's action protocol (the localhost REST endpoint, token and verbs). So an external agent can not only reason about the evidence, it can drive this analyser back — seek more records, aggregate, and plot a graph to show you the fault — exactly as the in-app assistant does.
Setup
Open Settings ▸ Assistant / LLM:
- Provider / model — Anthropic (Claude) or OpenAI, and a model id.
- API key — stored locally (cleartext, single-user tool). Never leaves your machine and is never included in a shared settings file.
Actions the assistant can take
From a reply the assistant runs bounded actions (within the round / per-reply caps in Settings) and feeds the results back. An optional localhost REST transport (off by default) lets an external agent drive the same verbs:
- aggregate — counts / rates over the index (the expensive parse is done once and shared).
- read — N records around an anchor, so an agent can seek the log through the socket without its
own file access. The anchor can be a record index, a byte offset, or
at(epoch millis — the record at-or-before that moment). By default each record is raw text;fields: ["instanceId.key"]projects just the named values per record instead — far cheaper when the question needs two numbers, not the whole record. - series — stats, threshold crossings and time buckets over any key or formula, computed in the
analyser. "Where does the spread exceed 0.004?" is one call returning the exact records (each with a
recordIndex/byteOffsetanchor for a follow-upread), not a page-through of raw text. - filter — narrow every view to the records in question.
- graph — plot a series or formula, with an optional
rationalethat captions the plot with why it was drawn (durable provenance).guidesdraws labelled threshold rules;bandsshades the intervals where a condition held;externalplots an agent-prepared(timestamp, value)CSV beside the audit-derived series — the clock is declared, never guessed, reads are confined to the exchange directory, and the chart is stamped so a foreign line can never pass as audit evidence;markersplots discrete events as glyphs (buys ▲ / sells ▼ on a price line) with a payload — an order id — on hover, and clicking a marker selects its record. - goto — select a record (by index, byte offset or
attime);reveal:trueun-hides one the current filter is hiding. - flag — bookmark records with a
noteand an optionalfix. Usekind: "confirmation"for correct behavior, labelled Observation / Assessment; otherwise new findings default tofault. This is the one place a finding is written; it then shows in the records table, as a callout on the Topology graph for that record, and in an exported report. Supplying only one ofnote/fixkeeps the other, so adding a suggested fix can't wipe the explanation it's a fix for. - screenshot — write a PNG of the app, or of one panel.
scope: "menu:File"opens a top-level menu and leaves it open, so an assistant can show you where a control is rather than describe it (menu:closeputs it back); the reply then lists the menu's items with where each one is in the window. The window is raised first: a native capture photographs a region of the screen, so anything sitting on top would otherwise be in the picture. - report — two forms. The single-record form writes one record's finding out as a PDF: the
explanation, the suggested fix, the event, the node log, a picture of the topology as currently
focused, and optionally a plot. The investigation form (
report {name, sections}) builds a named, persistent report from typed sections — findings, records, charts, tables, narrative — the account of an investigation, not just its evidence. It appears in the Reports tab, renders to PDF withpath, and exports a table's rows to CSV withcsv. A finding section renders whatflagwrote and the verb cannot set or change that text; narrative is always visibly labelled as narrative. See Investigation reports. -
coverage — which of the processor's nodes never wrote audit output in this run. Needs a log and a graphml, and answers the question nobody can answer by eye on a large graph: what did this run never exercise? A gap means "never logged", not proven "never ran" — a node with no
auditLogcall, or one whose dirty contract stops it early, is silent by design, and the result says so. -
spotlight — point at what it is talking about: dim the window, cut out up to six things, and give each a short numbered callout. See Ask it to show you below.
GET /manifest publishes a JSON schema for every verb, so a foreign agent learns the shapes up front
instead of trial-and-erroring against the structured errors.
Ask it to show you
An explanation you have to map onto the screen yourself is half an explanation. Any assistant driving the analyser — the built-in one, or an MCP client such as Claude Code — can point: it dims the window, cuts out the things it is talking about, and gives each a short numbered callout. You ask for it in plain words:
| You say | What the assistant can do with it |
|---|---|
| "Show me where live orders first went above 1 — point at it." | it finds the record, selects it, and lights that row |
| "Where do I start a project from a template?" | it opens the File menu and lights New project from template… |
| "Which node never logged? Highlight it on the graph." | it runs coverage, opens the Topology tab, and lights the node |
| "Walk me through this cycle and highlight each step." | it lights the record, the node's lines in the detail, and the node on the graph — numbered 1, 2, 3 — and its sentences use the numbers |
| "Highlight everything involved in that breach." | up to six things lit together, each with its own callout |
| "Point at the note on the chart you mean." | it lights that numbered note on the plot |
| "Clear the highlights." | they go out (so does any click, or Escape) |
(How an assistant answers is up to the assistant; the right-hand column is what the actions make possible, and what the guidance it is given asks of it.)
One thing lit — here, the demo's one real finding, a node the graph declares that never wrote audit output:
Design-line and bean targets are measured after scrolling settles and must fit inside the XML
text viewport. A set that cannot fit together is refused. With add: true, targets scrolled
away appear in wentOut, and surviving highlights retain their numbers. Successful bounds
refer to the painted cut-outs in the default screenshot, with positive dimensions.
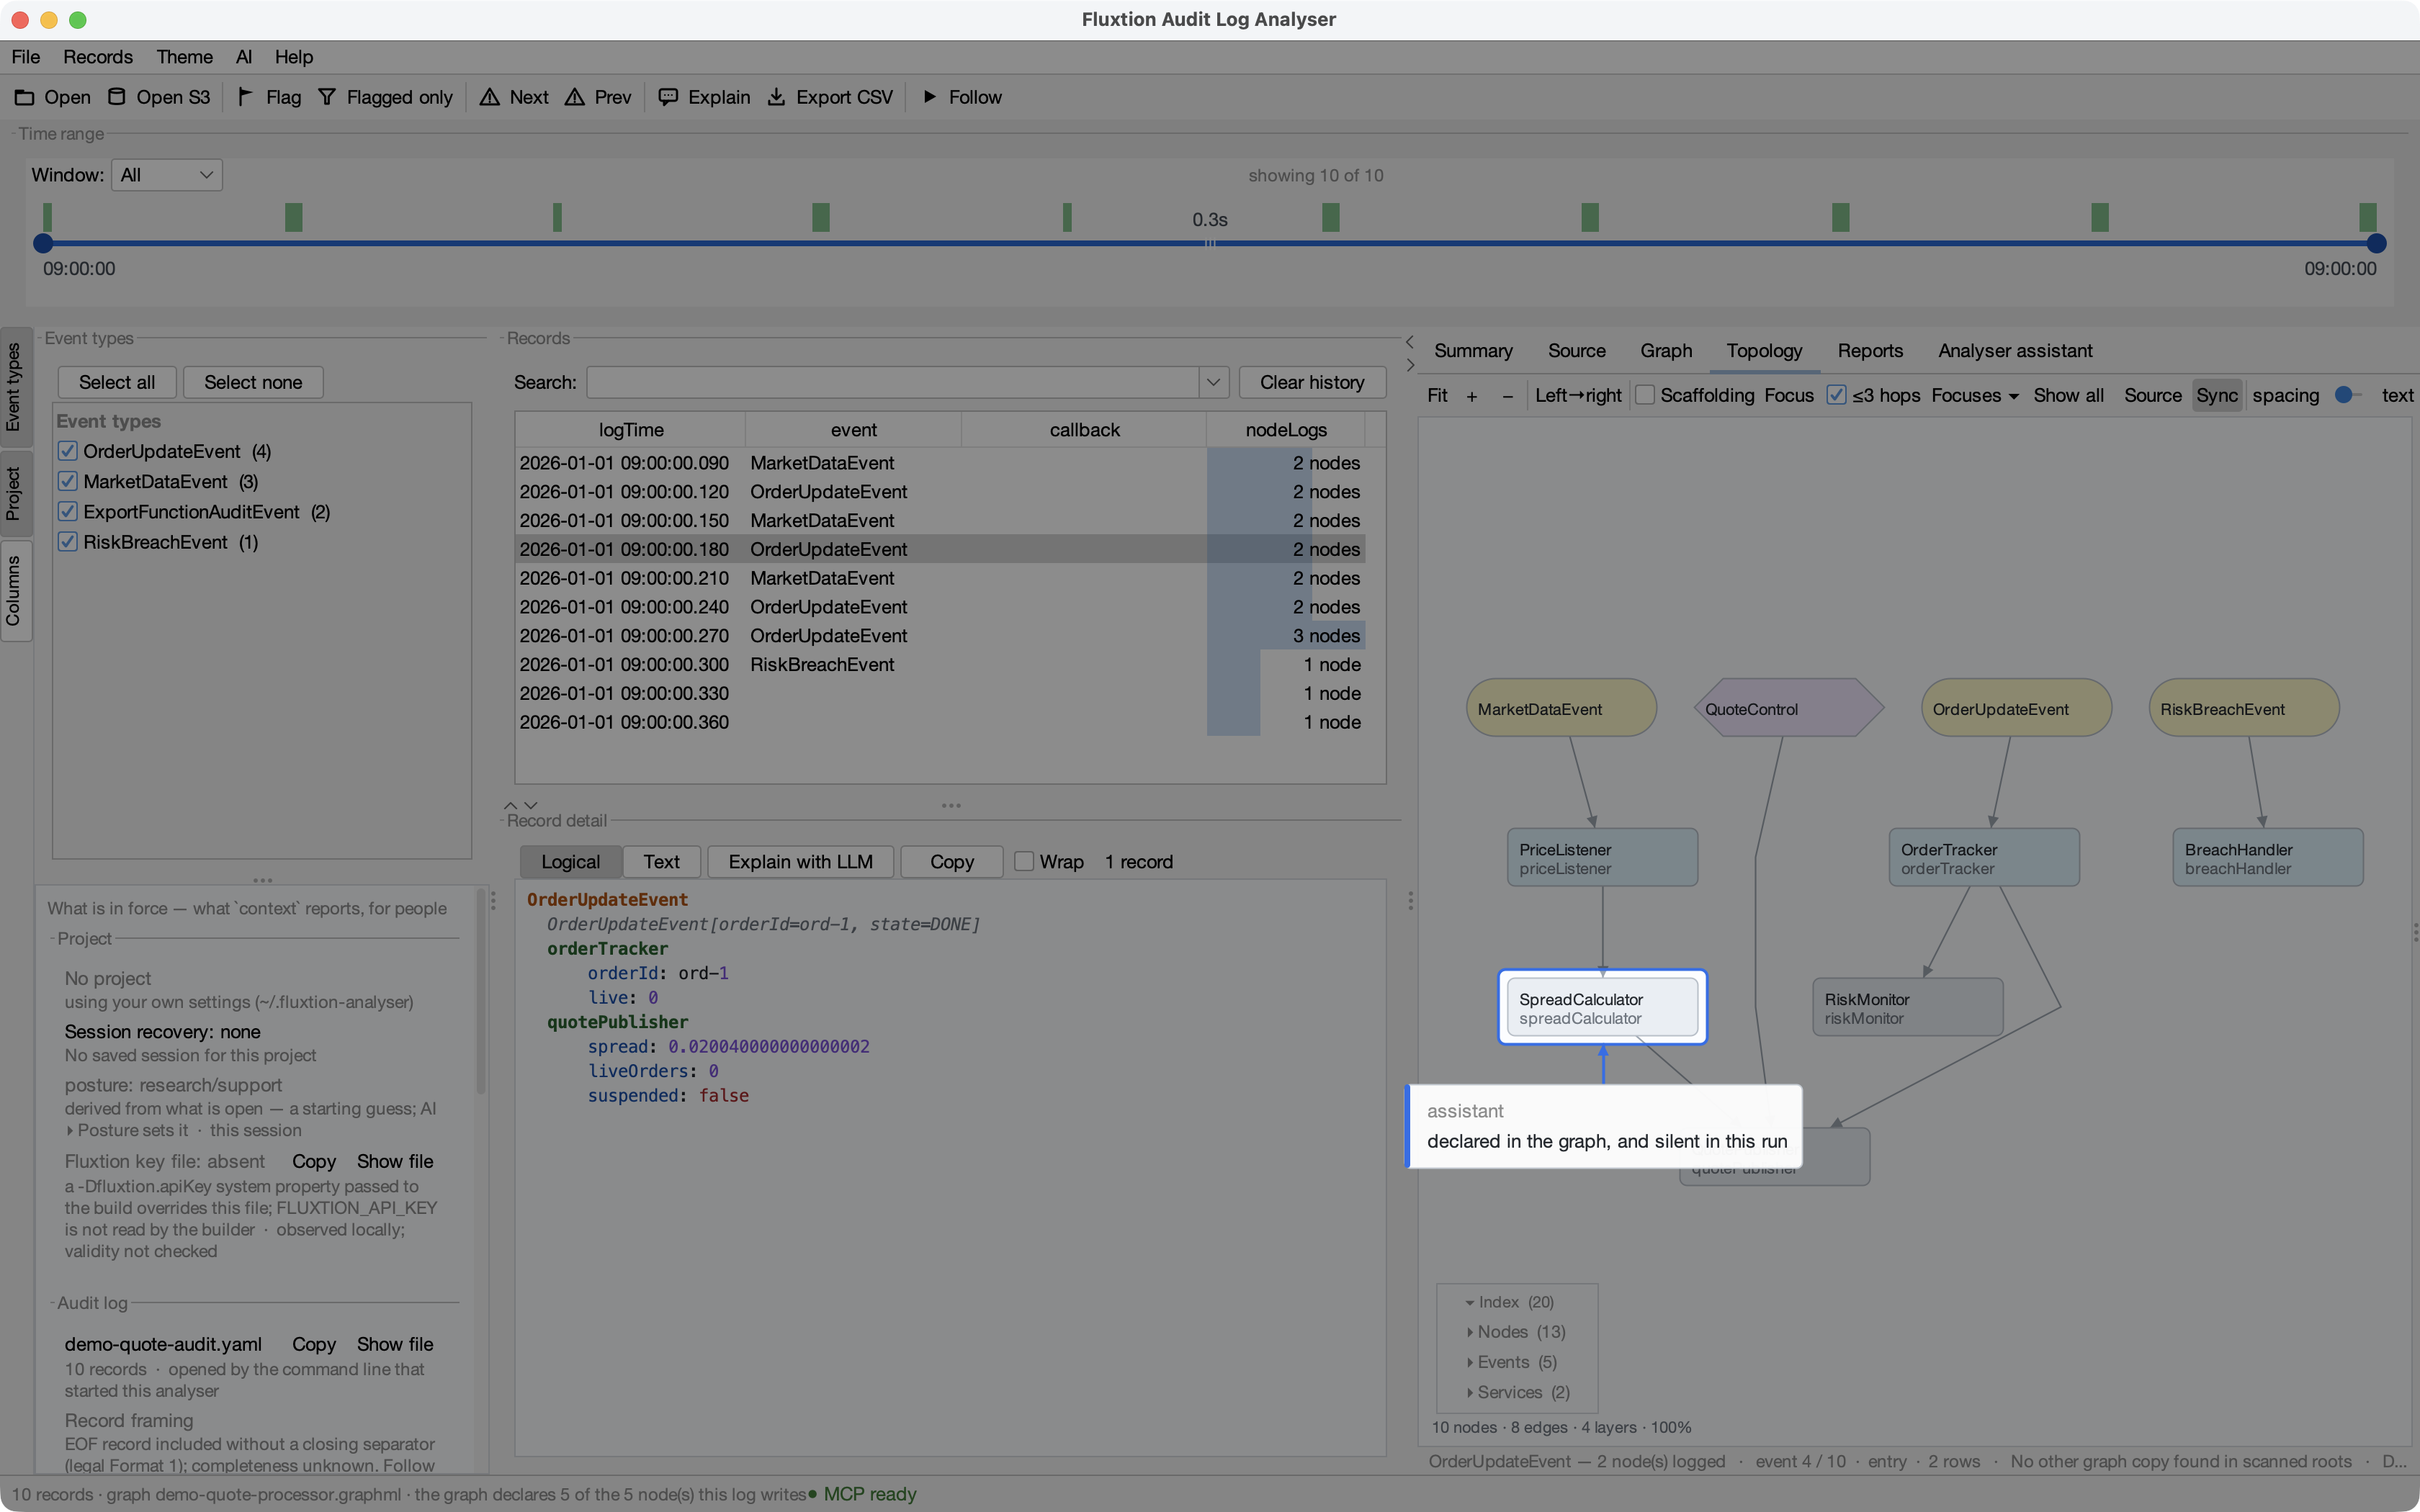
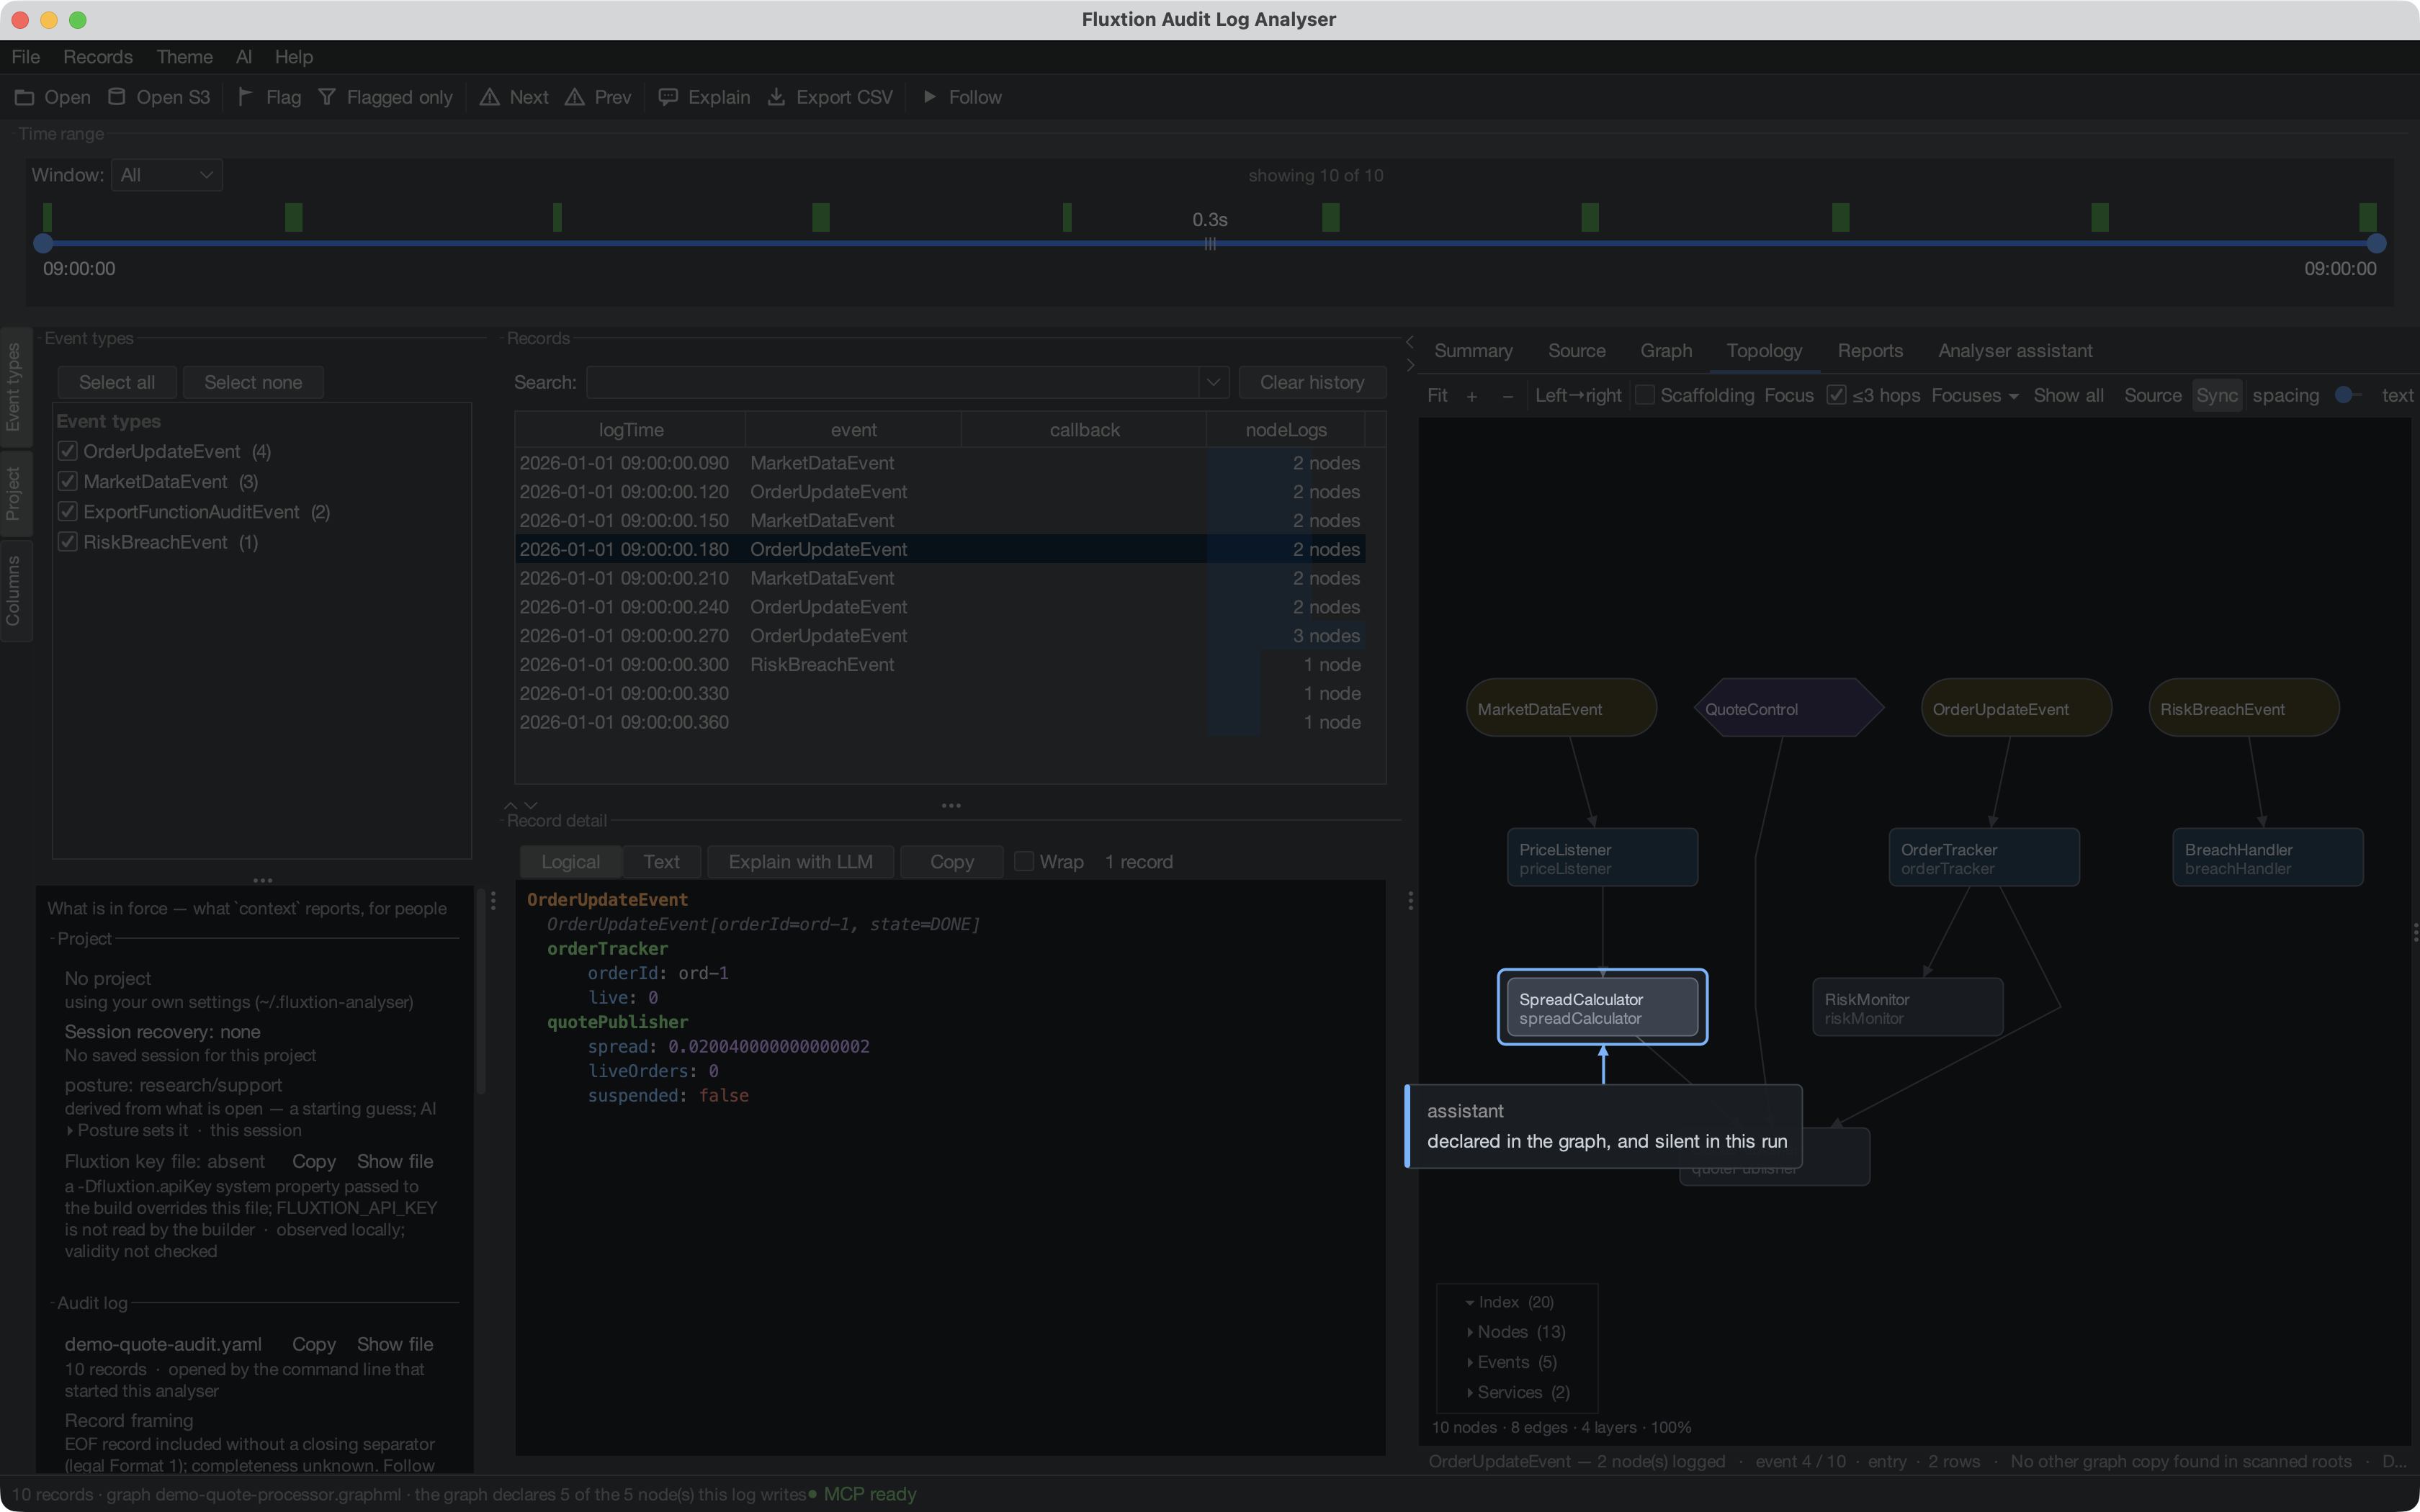
And a finding that is a relation between things — the node every price arrives at, the node it feeds that stayed silent, the line where the analyser states how the graph fits the log, and the record on screen — lit together and numbered, so the assistant's sentence ("1 feeds 2, and 2 never logged") finds its place on your screen:
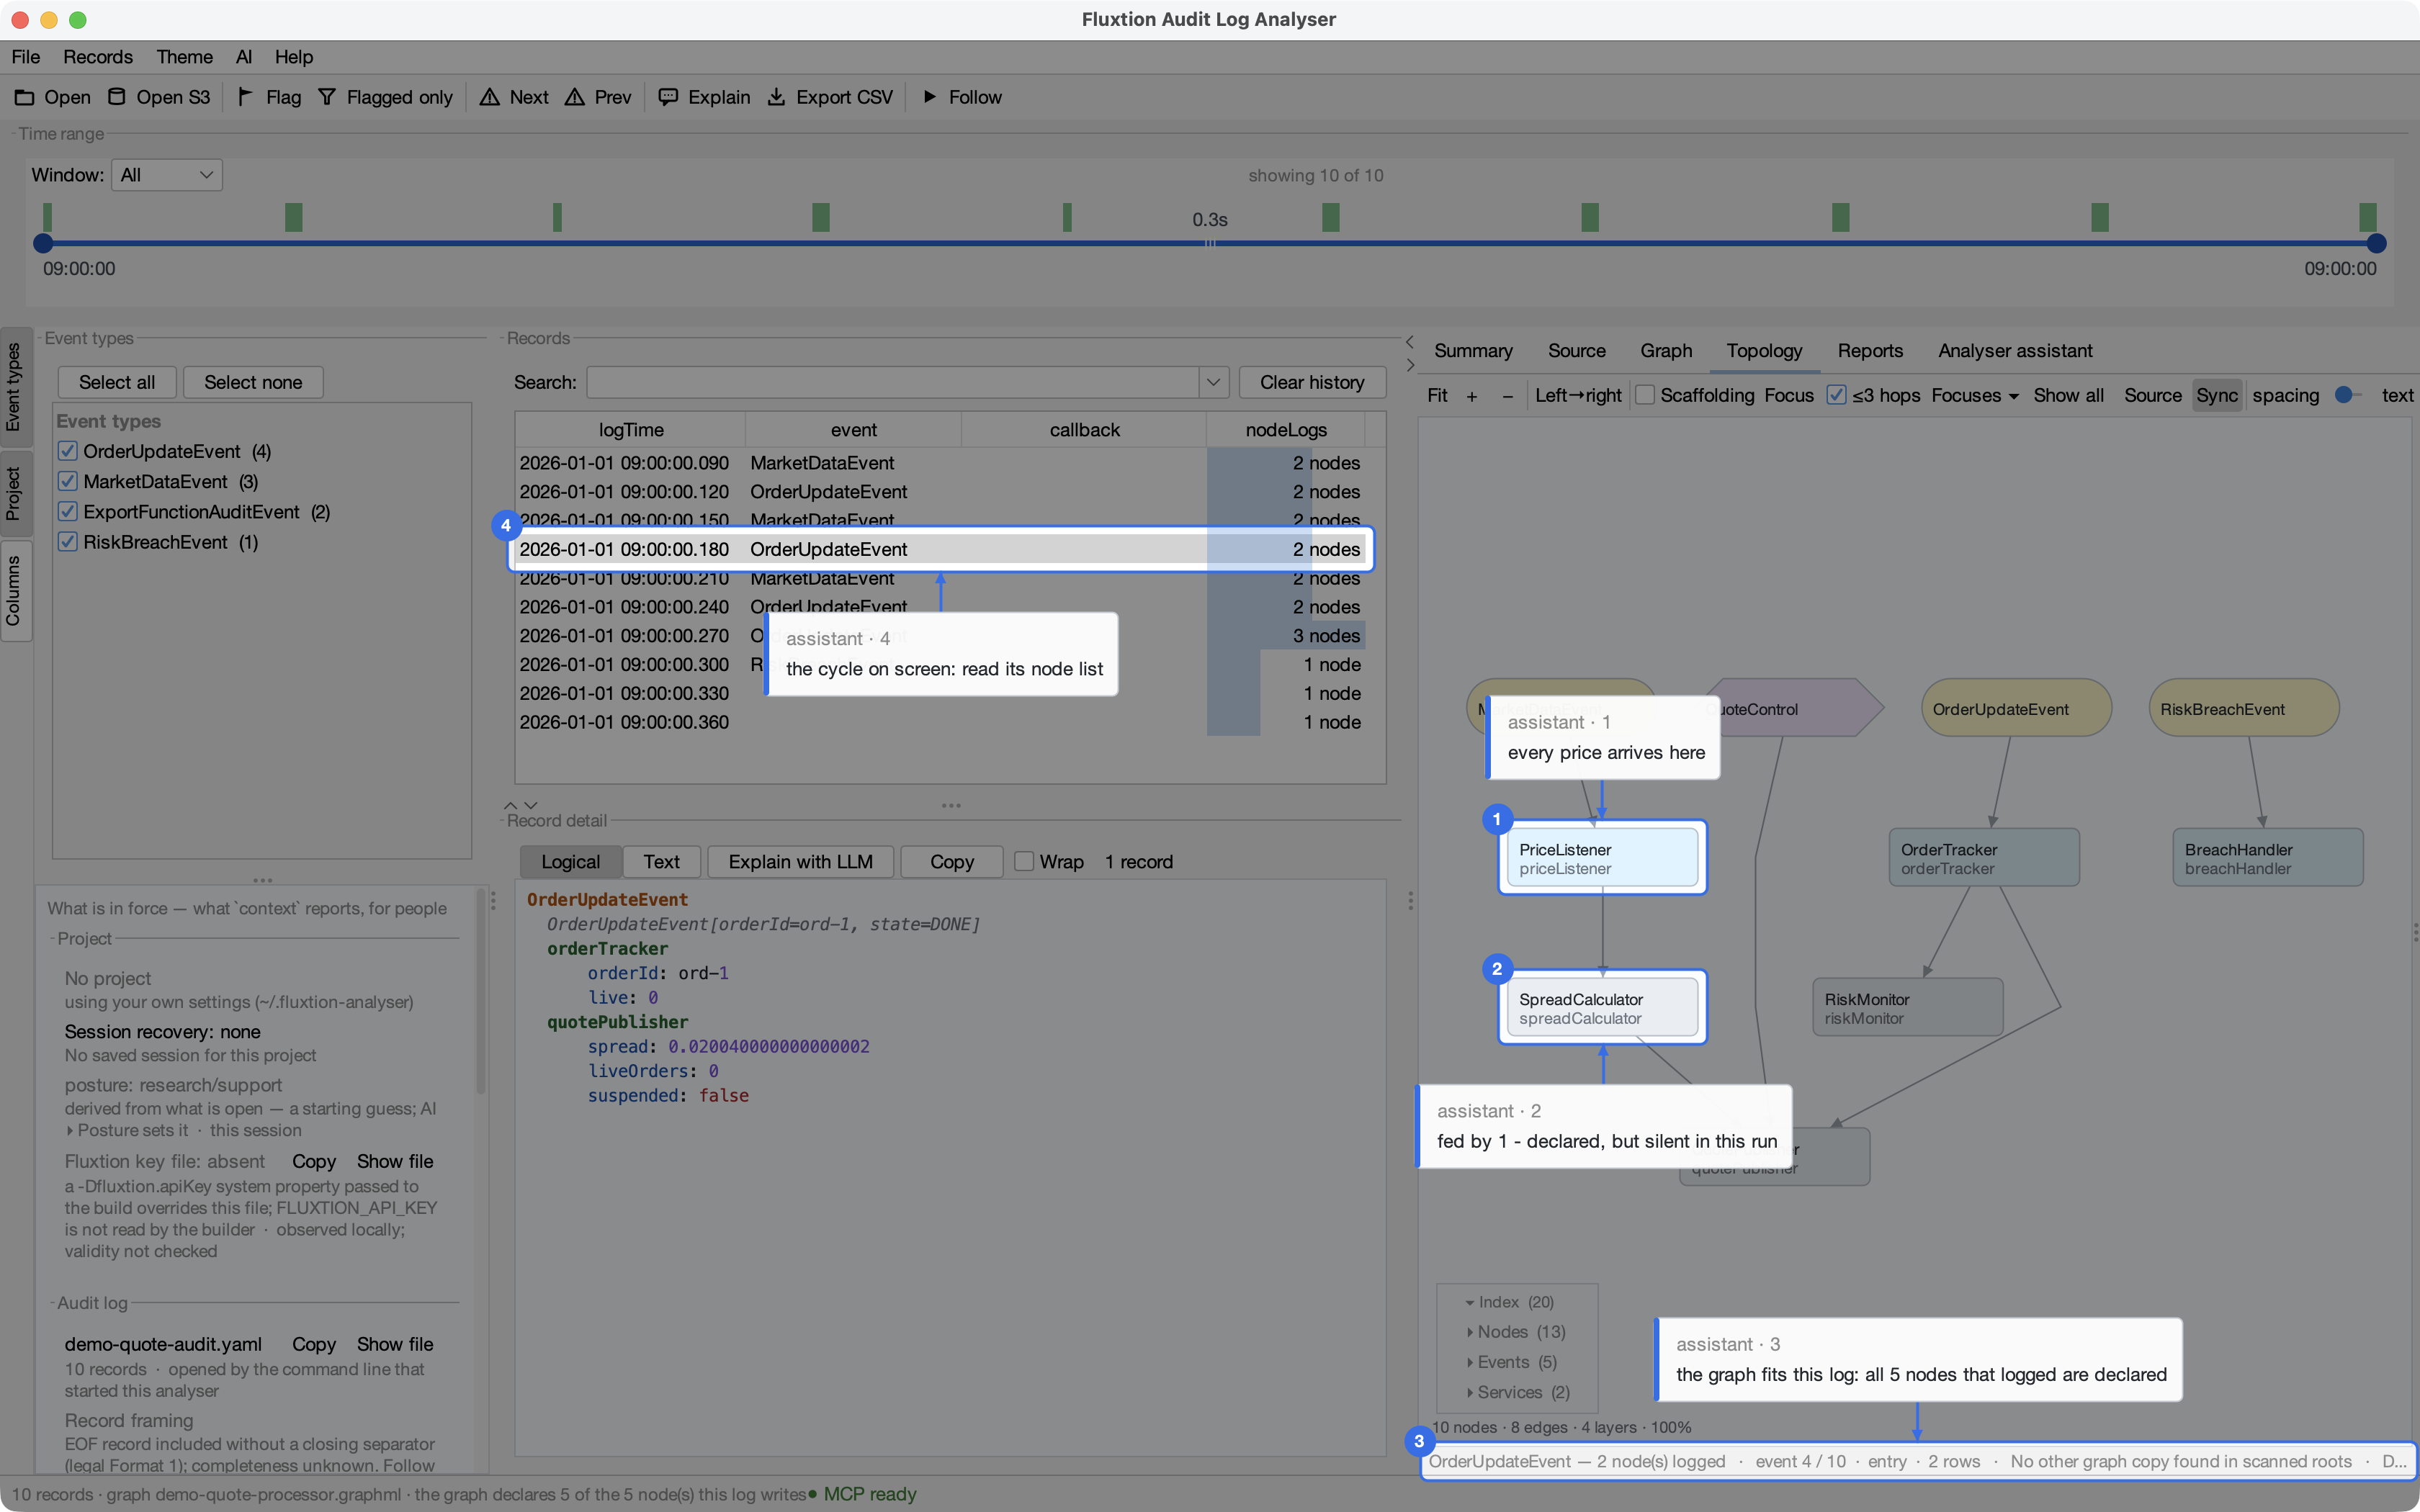
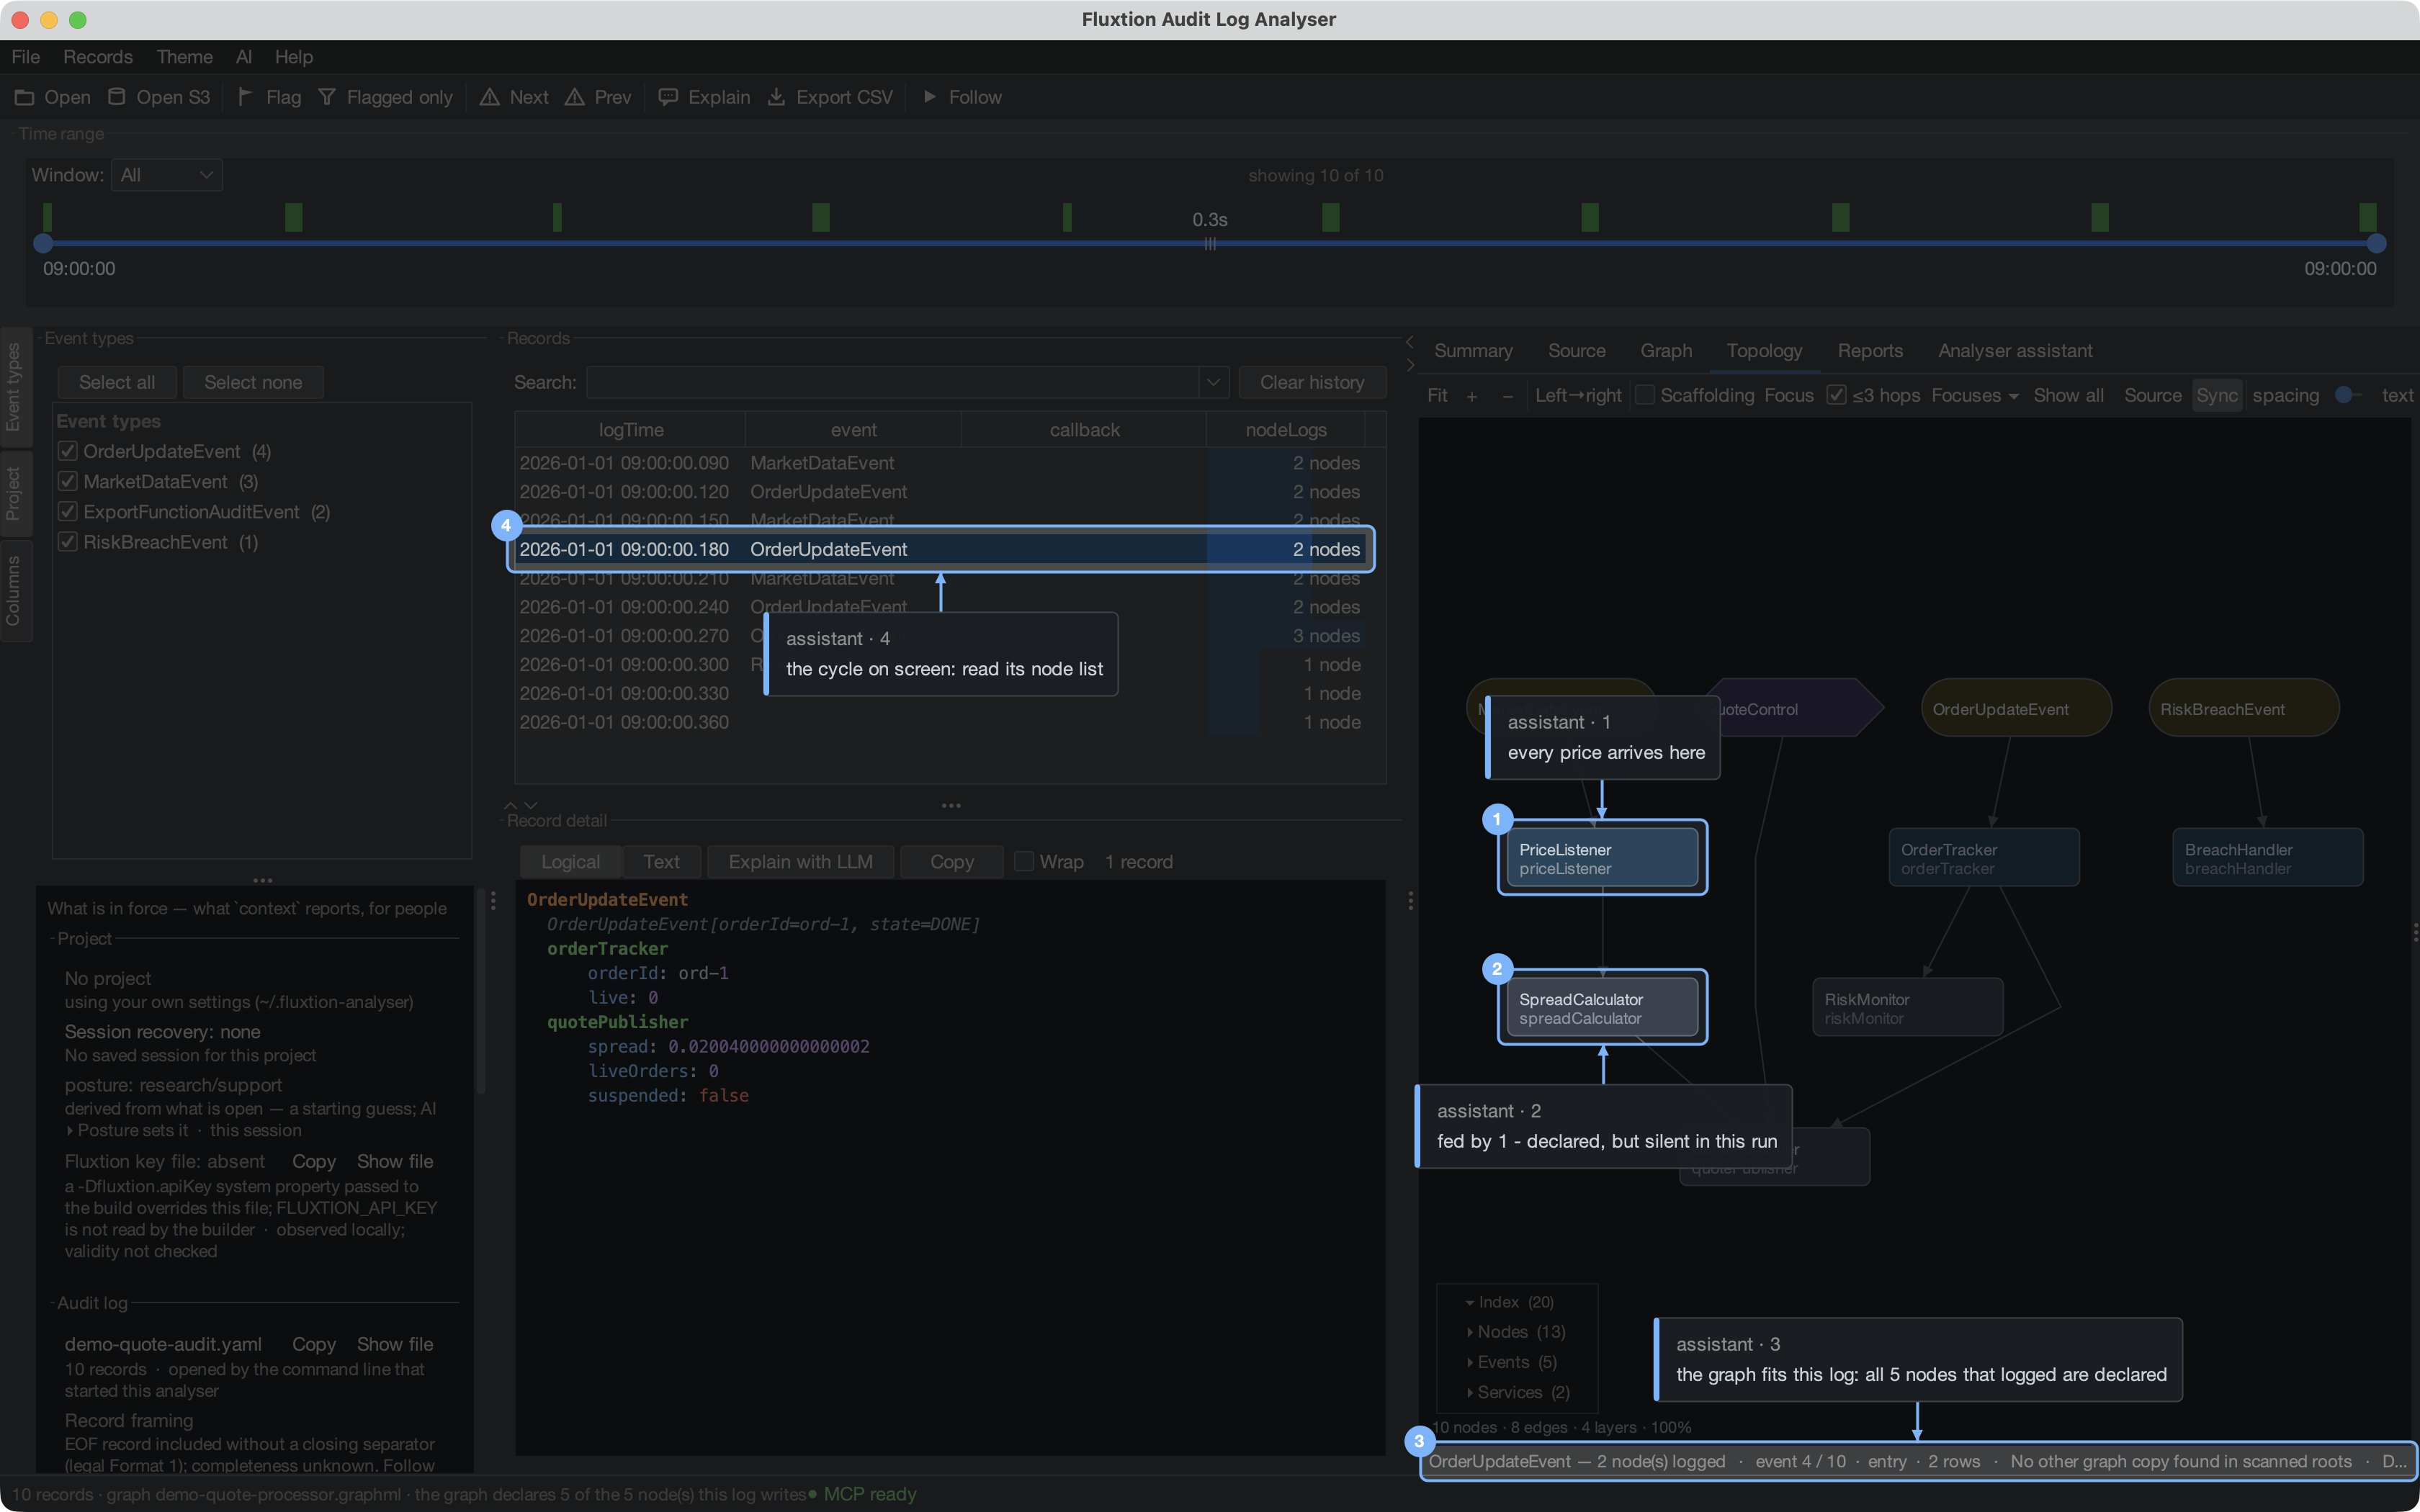
Four things worth knowing before you rely on it:
- A callout is the assistant's words, not the analyser's. That is why every one is tagged assistant. It shows you where to look; whether the claim is true is what the thing it points at tells you. If a callout says something the screen under it does not bear out, believe the screen.
- Highlights are temporary by design. Any click, Escape, or any change of view (a new filter, another record, a redrawn chart) puts them out, because a highlight left pointing at where something used to be is worse than none. Nothing about one is ever saved — not in settings, a project, a graph or a report. A finding you want to keep is a flag, a chart note or a report: ask for one of those as well.
- Everything lit has to be on screen together. A topology node and a note on a chart live on different tabs, so the assistant lights those one after the other rather than at once — and says so if you ask for both.
- An assistant is told to do this unprompted — the guidance travels with every way one connects (the built-in assistant, a copied prompt, an MCP client) — but only where you would otherwise have to hunt. If it explains something without pointing, "show me" is all you need to say.
Connect an MCP client
Step-by-step, with a working check
Connecting an LLM to the analyser walks the connection through in order and shows how to confirm each link works before relying on it. This section is the reference.
If your agent speaks MCP (Model Context Protocol), it can drive the analyser with no prompting and
no copied token. The application supplies the local bridge command, ending in --mcp, through
Connect an AI client; it is an installed JBang launcher or the exact Java-and-jar vector for this
machine, not a command you need to reconstruct.
The client discovers one tool per verb — analyser_aggregate, analyser_read, analyser_series,
analyser_filter, analyser_graph, analyser_goto, analyser_flag, analyser_coverage,
analyser_topology, analyser_report, analyser_context, analyser_screenshot, analyser_open,
analyser_source_root, analyser_source and analyser_spotlight — with full parameter schemas, so
there's nothing to paste into a prompt.
spotlight lets an AI client point (Ask it to show you has the pictures and
what to say). spotlight {target, caption} lights one thing; spotlight {targets: [{target, caption}, …]}
lights up to six together, numbered n on screen and in the echo so the client's sentence can refer to
them; {add: true} keeps what is already lit, and {clear: true, target} puts out just one (the others keep
their numbers — the chat that named them has already been read). A set is all or nothing: one target that
does not exist, or two that cannot be on screen together, refuses the whole call with the reason.
The targets are a small fixed vocabulary, named as you would say them — source:design,
source:design:bean:<id>, source:design:line:<n> (the session design), tab:topology,
records:row:12, detail:node:<instanceId>, topology:node:<instanceId>, topology:verdict (the line where the
analyser states how the graph fits the log), graph,
graph:note:2, graph:series:<label> (the selected chart) or graph:<name>:note:2, graph:<name>:series:<label>
(a chart by name — lighting it selects that chart), project:log, toolbar:flag, menu:File and
menu:File:New project from template… (the menu opens and the item is lit; a click on it chooses it, and the
spotlight goes out with the menu), status. A target that is off
screen is brought on screen first (its tab selected, its row scrolled to — a filtered-out record is
revealed the way goto reveals one — its node centred); one that does not exist is refused with the
reason, never lit on nothing. screenshot and context leave a spotlight lit: they are how the client
checks it lit what it meant — context.spotlight.lit lists what is lit, and a screenshot shows it exactly as
you see it.
source is a read-only file glance: {file}, {file,line}, {line}, {bean}, {file,bean}, {fqn} or
{fqn,method}. It re-reads the local XML/Java file under authorised roots. open {design} declares the
session design; open {diagnostics} explicitly replaces its producer findings and clears them on refusal.
Both work without a log. See Source navigation.
The source-root grant now covers Java, XML designs and producer JSON; project membership alone is not a grant.
open also writes to the shared canvas — state you and the AI client both see and either of you can
set — because open is the verb that already means put this in force. Two things live there. Posture: whether this session is research/support or
authoring/deploy. The analyser guesses it from what is open (a project open reads as authoring) and
says when it is only guessing; open {posture: "authoring"} — or AI ▸ Posture — sets it, which
matters because intent changes before any file does ("let's build something new"). The authoring
mode selector's record: open {record: {…}} places the selector's --json output, so the modes in
force, the figures the catalogue resolved and what is left to author sit where both of you can read
them (AI ▸ Place mode-selector record… does the same from a file). The analyser never runs the
selector and does not check the record — it carries it, attributed to whoever placed it. Both are read
back in context.handoff and shown on the Project panel; both belong to the session — a project
switch clears them, open {close: "handoff"} takes them off again (the same idiom as
open {close: "project"}), and nothing is written to the project profile. A malformed record is refused
whole, with the reason; and a canvas write goes alone — combined with a log, a graph or anything else
open does, the call is refused rather than half applied.
open {analysis: name, bind: {…}} recalls a saved analysis (Portable context ▸ Repeatable analyses) —
context.analyses lists them with their parameters; steps run through this surface and stop at the first failure.
open also takes logs: [...] — an explicit rolled set, loaded as one log in content order, the
echo carrying the order chosen and the time-order report (see Records ▸ Rolled log sets).
Three more on open, so an agent can manage what is loaded rather than only add to it:
open {close: "log" | "graph" | "all"}— the counterpart of opening, and the way to switch cleanly between systems. Log-derived state clears; your named graphs, focuses, source roots and reports are profile state and survive, each saying why it cannot resolve rather than vanishing. Combining it withlog/graphmlcloses and names what it ignored, rather than leaving you to guess which half of an incoherent request was honoured. Closing the log (orall) while a log is still loading cancels that load — the last deliberate request wins, so a log you no longer want does not arrive a moment after you closed — and the echo says so insupersededPendingOpen. Closing only the graph leaves a loading log alone.open {discover: "graphml"}— lists every.graphmlunder the source roots, ranked against the open log, with each one's node count and how many of the log's nodes it declares. It opens nothing: pick one and pass it asgraphml.-
open {graphml: …}now answers does this fit? in the same call —appliesToOpenLog, the counts, and the verdict — so switching processor needs no follow-upcontext. -
open {project: "<project dir, or its .analyser/project.fluxtion-settings>"}— switch to a project, the same act as File ▸ Open project…, and the way to accept theprojectOfferthatcontextreports. It applies rather than asks — a dialog cannot be answered over the socket — so its echo carries the safety: every category the switch replaced with before/after counts, what it closed and where those files were (the log and graph — a project is a session boundary), which project was active before, and the one call that puts it back.open {close: "project"}is that call when the answer was your own settings. Re-opening the project already in force changes nothing and says so. Your MCP client's per-call approval onopenis the human gate. open {log, provenance: "…"}— say WHERE the log came from. A file name is not a system: an agent exporting three servers' logs to/tmpproduces three artefacts nobody can tell apart. Provenance rides the status bar,context, report headers and PDFs, and lets the mismatch banner name a system rather than a temp file. Omit it and the analyser says nothing — it is never inferred from the path, because a guessed system name is worse than none.
Opening a log is asynchronous — read context or topology after it
open {log} returns as soon as the load starts, so its echo cannot carry what the load
discovers: the declared ordering, the graph the source supplied, the time-order report, the
project offer, or — when the file is one member of a rolled set — the set offer
(rolledSetOffer, with the member files; open {logs: [...]} loads them). All are reported by
context (and topology) once the load lands, and none of them is ever a dialog on this path. This is
one pattern, not four exceptions — if you need any of them, call context after opening.
When the project points at a glossary (Portable context ▸ Vocabulary), its text leads every Explain
prompt and is served as context.vocabulary.text, so the assistant reads live the way this system means it.
context is also what the Project panel draws (User guide ▸ The Project panel): one payload, two
readers. It reports the graph whether or not a log is open, log.openedBy (you, the action socket, the
command line that started the app, or — for a log the app reopened by itself — the previous session,
restored at startup: an agent should not treat that one as a log anybody chose),
graphPairing.graphPath, processors as a list with selected and whether source was found, and
source.rootTiers — each root with the tier that supplied it (project, own settings, demo (transient)) and
the form it is stored in (project-relative, workspace-relative, ~, absolute), plus source.workspaceRoot
when the project declares an anchor.
Five keys the closing M38 review found described in prose but not by name — an agent looks for the handle:
dispatchOrder (whether position in nodeLogs is dispatch order — total — or merely arrival — PARTIAL;
never read PARTIAL as causality), timeOrder (present only when the log's timestamps are out of order —
the report summary, so disorder is announced rather than discovered through wrong answers), graphPairing
.sourceGraphDeclined (a reader offered a graph but an OPENED one holds the slot — opened beats supplied),
reports[].createdAt, and source.workspaceDir (where the declared workspaceRoot resolves on this machine —
two facts, not one).
The project's portable context (User guide ▸ Portable context; the AI-side manual is Working with AI ▸ Runbooks,
glossary and saved analyses with an AI) rides the same payload: runbooks[] (pointers —
read the file from the repository; the analyser never executes one), vocabulary (with the glossary's text),
environments[] and provenanceSource (who supplied the log's provenance — declared by the opener always
wins), analyses[] (the offer; recall with open {analysis, bind}), and reportDestinations[] (places the
publisher acts on; the analyser never publishes).
graphPairing also carries auditLogging (enabled / not_enabled / unknown) with an
auditLoggingNote. That is read from the graph, not the log, so it answers before a log exists — a
processor built without addEventAudit() writes no audit log at all, and an agent told that up front
does not open an empty file and conclude the system was quiet. unknown with no graph loaded: with no
evidence the answer is "unknown", never "probably fine".
context carries graphPairing for the same reason: whether the loaded graph belongs to the loaded
log is something to know before deriving anything from it, not after coverage returns a
suspicious number. It also reports projectOffer when the log sits inside a project — the offer a
human would see as a dialog, which an agent gets as data instead, because a dialog nobody can answer
would simply stall the session.
aggregate, read, series, context and coverage are marked read-only. The verbs that only change what the
app shows are reversible and marked accordingly. Four are marked destructive, so a client can prompt
before running them: open replaces the loaded log (taking the session's flags with it), source_root
writes the persisted config, and screenshot and report write files.
Those last two are off by default. Turning on Allow assistant file exchange (Settings ▸ Assistant) lets them write only inside the exchange directory you choose, and they never overwrite an existing file — so a second export under the same name is refused rather than silently replacing the first. Exports you drive yourself, through a File menu chooser, are unaffected: picking a location in a dialog is the authorisation.
Does my client launch the analyser?
No — you start the analyser yourself, and leave it open. Your MCP client launches a small bridge
process (the --mcp command shown in Connect an AI client); the bridge then talks to the analyser
you already have running.
It works this way because the point is to drive your live session — the log you have loaded, the graphs you have open, the flags you have set. All of that lives in the running desktop app. A freshly spawned subprocess would have none of it, so the bridge forwards to the app instead of trying to be one.
So the working setup is:
- You open the analyser and load a log, as usual.
- You enable Settings ▸ Assistant ▸ localhost REST transport (off by default) — once; it's remembered.
- Your client starts the bridge on its own, whenever it needs a tool.
If you skip step 1 or 2, the tools still appear in your client, but calling one answers "analyser not
running, or REST transport disabled — start the app with --rest". That flag turns the transport on
(persistently) and prints where the endpoint file is, so an agent can bring the analyser up on a fresh
machine without a human at the keyboard.
Set up an MCP client in the app
Open Connect an AI client from the Start page, or from Settings ▸ Assistant / LLM. Opening the screen only inspects this analyser; it does not change a client configuration. Its Bridge command is the exact local launcher this installation can use — the installed JBang launcher or the current packaged application, including an absolute Java path where one is required. Do not shorten, split or substitute that command.
First turn on local transport for this already-open analyser, then choose Check connection. The
check launches that same bridge and makes one read-only analyser_context call. A successful check proves
the analyser → bridge chain for this window; it cannot prove that a foreign client has imported the setup
or made a model call.
Choose the client you use:
| Choice | What the analyser can do | What remains yours |
|---|---|---|
| Codex | After an explicit confirmation, run the installed Codex CLI to add, replace or remove the fluxtion-analyser registration. It also offers a copyable command if the CLI is unavailable. |
Approve the change and confirm it in Codex. |
| Claude Code | After an explicit confirmation, register a user-scoped fluxtion-analyser server with the installed Claude Code CLI. A project-scoped command is copy-only. |
Run the project command from the intended project root, if that is the scope you want. |
| Claude Desktop | Explain the supported fallback and take you to Generic MCP setup. The analyser does not claim to ship or install a Desktop extension. | Use Claude Desktop's own supported configuration/installation flow. |
| another MCP client | Render the complete standard mcpServers JSON record from the exact bridge argument vector; copy it, or save it to a file you choose. |
Put that record in the configuration location and approval flow your client documents. |
The generic JSON contains only the local stdio launcher and its separate arguments. It never contains the running analyser's endpoint, per-run token, loaded log, or an approval choice. The bridge discovers its fresh endpoint and token when the client starts it, so a registration survives analyser restarts without being rewritten.
These names intentionally identify different layers, not separate servers:
| Layer | Name | Where you see it |
|---|---|---|
| JBang executable | analyser |
jbang analyser@telaminai/fluxtionauditlog-analyser and normally ~/.jbang/bin/analyser after installation |
| MCP client registration | fluxtion-analyser |
Codex, Claude Code, or a generic mcpServers entry |
| MCP bridge protocol | fluxtion-audit-log-analyser |
the bridge's serverInfo.name response |
The setup screen resolves the installed executable and registers it under the MCP client label, so none of the three names needs to be manually renamed. Codex may need a larger tool timeout for an aggregate over a very large log.
Your first session
Start your CLI client anywhere — the analyser tools aren't tied to a project directory. First check the server actually connected, then say what you want:
$ claude

> /mcp
  ⎿ fluxtion-analyser   ✔ connected · 15 tools
       analyser_aggregate · analyser_read · analyser_series
       analyser_filter · analyser_graph · analyser_goto
       analyser_flag · analyser_report · analyser_coverage
       analyser_context · analyser_topology · analyser_screenshot
       analyser_open · analyser_source_root · analyser_source · analyser_spotlight

> I have a Fluxtion audit log open in the analyser. Use the fluxtion-analyser
  tools to work out why the hedge stopped quoting.
That first message is the whole handshake on your side. You mention the server by name once so the agent reaches for these tools rather than, say, grepping your filesystem; after that it just uses them. There's no path to give it and no token to paste — it's already pointed at whatever log you have open.
If /mcp shows nothing, the client never started the bridge: re-check the config paths in the tab above.
If it shows connected but a call comes back "analyser not running", the bridge is fine and the
app is the missing half — open it and turn on the REST transport.
From there the agent works, and you watch it work:
⏺ analyser_aggregate(metric: "count", groupBy: "dimension")
  ⎿ total 21 records
     orderUpdate 10 · ScheduledTriggerNode 3 · orderVenueConnected 2
     onMultilevelMarketData 2 · registerService 2 · LifecycleEvent 1
     marketDataVenueConnected 1

⏺ analyser_read(recordIndex: 1, count: 3)
  ⎿ hedgeConnectionMonitor: { orderVenueConnected: …, status: CLOSED, hedgeQuantity: NaN }
     hedgePositionMonitor:  { hedgePositionBreach: false, hedgeStatus: CLOSED }

⏺ analyser_graph(name: "hedge quantity",
                series: ["hedgeConnectionMonitor.hedgeQuantity"],
                rationale: "hedgeQuantity goes NaN when the venue drops")
  ⎿ {"ok":true,"applied":{"name":"hedge quantity",
      "resolved":["hedgeConnectionMonitor.hedgeQuantity"],"unresolved":[]}}

⏺ analyser_flag(recordIndexes: [1, 2], note: "hedge went NaN here")
  ⎿ {"ok":true,"applied":{"flagged":2}}

  The hedge monitor reports status CLOSED with hedgeQuantity NaN from the venue-connect
  event onward, so the quote calculator had nothing to size against. I've plotted
  hedgeQuantity as "hedge quantity" and flagged the two records where it flips.
Watch the analyser while this runs. A hedge quantity tab appears, captioned with the agent's
rationale; two rows pick up flags. The findings land in your instrument, as things you can click,
zoom and trace to source — not as prose you have to take on trust. That's the whole point of the round
trip: you verify the claim against the same data it was made from.
Note what the agent didn't need: no file path, no token, no pasted records. It read the log through
analyser_read over the socket.
Hand the diagnosis on
A plot answers "this trend is wrong". To answer "this cycle is wrong, and here's why", compose
the verbs you already have with report:
⏺ analyser_flag(recordIndexes: [40],
               note: "quotePublisher republished before riskMonitor re-evaluated the limit,
                      so the quote on the wire was priced against stale risk state.",
               fix: "riskMonitor must be upstream of quotePublisher — check the @OnTrigger ordering")

⏺ analyser_goto(recordIndex: 40, reveal: true)

⏺ analyser_topology(select: "quotePublisher", scope: "routes", focus: true)
  ⎿ {"ok":true,"topology":{"visibleNodes":7,"totalNodes":20,"callout":true,
      "finding":{"note":"quotePublisher republished before …","fix":"riskMonitor must be …"}}}

⏺ analyser_report(path: "finding-40.pdf", title: "Stale risk state at record 40",
                 graph: "Mid price")
  ⎿ {"ok":true,"wrote":{"path":"…/finding-40.pdf","recordIndex":40,
      "hasExplanation":true,"hasFix":true,"topology":true,"graph":"Mid price"}}
topology echoes back the finding it is showing, so an agent can confirm the graph is displaying its
diagnosis rather than assume it. The PDF is the artefact you send to someone who wasn't watching: the
explanation next to the event, the node log, the graph and the plot it rests on.
The topology verb's callout field is a visibility switch and nothing more — the text always comes
from the record's flag. One place to write, several to read.
scope: "routes" on a sink comes back bounded, and says so. Every route into a node that everything
feeds is the graph, so on a large graph where all routes would cover more than half of it the answer
stops at three hops each way. The echo is explicit rather than quietly returning less than the scope's
name promises:
{"scope": "routes", "routeBound": true, "scopeBounded": 3,
 "scopeNote": "'routes' was bounded to 3 hops because all routes would cover 198 of 309 nodes …"}
Pass routeBound: false for every route, however many — the same switch as the ≤3 hops checkbox in
the toolbar, so the screen and the socket never disagree about what is being shown.
Let your agent set it up
An agent can help with an explicit client-CLI registration, but the analyser is the source of the launch command: install it with JBang, open the app, then use Connect an AI client. It presents the exact bridge vector for this machine and asks before it invokes either supported client CLI. For an unknown client, copy or save the Generic MCP record and apply it only where that client's documentation says. An MCP client must still ask for approval for its own tools; the analyser cannot grant that approval on its behalf.
Reading coverage results
The denominator counts only what could log. Event classes and exported service interfaces appear in
a graph because the processor handles them, not because they run, so counting them as "never logged"
reports a category error as a low score — on the demo that alone read 50% where the honest figure is
100% of what can log. Anything left out is named in excludedFromDenominator with its reason, and
summarised in excludedNote: a denominator that quietly shrinks is the same dishonesty as one that
quietly includes.
With source roots configured, a node whose class cannot reach an audit logger at all is left out
too — but read that exclusion carefully, because it is not reassurance. Such a node is not observable
in any audit log, so the ratio is silent about whether it ran rather than vouching for it, and
excludedNote says so by name. Exclusion requires proof: a node whose source is missing, or whose
supertype the analyser does not recognise, stays counted. Assuming silence is the one error you cannot
spot from the output.
When nodes are uncovered, the answer also carries auditLevels / auditLevelFinest /
auditLevelNote. A gap can be the level rather than a silence: if the log was captured at INFO,
any debug() or trace() call wrote nothing, so a missing node may have run and logged below the
threshold. The note states the levels present and what they would have discarded, and stops there — the
log cannot distinguish "the threshold excluded them" from "nothing called debug()", so neither does
the analyser.
Setup notes:
- Edit the config only while the analyser is closed. The running app holds settings in memory and
writes the file on exit, so an edit made while it's open is overwritten. Toggling it in
Settings ▸ Assistant is always safe.
- jbang caches jars. If --mcp isn't recognised you're on an older cached build — jbang cache clear,
or run once with --fresh.
- Launching needs a desktop session; the app is a GUI, so it will not work over a headless SSH shell.
Setup is shell work, not an MCP tool
Installing, configuring and launching are deliberately not exposed as MCP tools. The Connect screen is a human UI that can invoke a supported client CLI only after confirmation; generic and Claude Desktop configuration remain yours to apply. It would be circular for an MCP tool to install the bridge it needs, and the analyser's MCP surface is deliberately limited to log verbs.
How it finds your running analyser
REST picks a fresh port and mints a fresh token every launch, so there is nothing stable to hard-code.
Instead, while the transport is running the app writes its live endpoint to
~/.fluxtion-analyser/rest-endpoint (owner-readable only), and the bridge reads it on every call.
Two things follow, both useful:
- Configure once. No token in your client config, and nothing to update after a restart — the bridge picks up the new port and token by itself.
- Connecting doesn't need the app. Your client can start and list the tools with the analyser closed; only the calls need it running.
If it isn't working
- "analyser not running, or REST transport disabled" — exactly what it says: either the app isn't open, or the REST transport is off in Settings ▸ Assistant. The same message appears if the app was killed, because the bridge checks the recorded process is still alive before trying to connect.
- The server won't start at all — reopen Connect an AI client and use the exact bridge command it resolves for this installation. It should sit and wait for input rather than exit when run from a terminal.
- Claude Desktop: per-server logs are at
~/Library/Logs/Claude/mcp-server-fluxtion-analyser.log(macOS). The bridge writes all diagnostics to stderr, so they land there. - Rate limiting — a burst of calls gets a "rate limited" tool error rather than a broken connection. It's retryable; the agent should pace itself.
What it can and can't do
The MCP door opens the same verbs as the other transports and nothing more — one tool per verb,
discovered live, so the list you see in your client is the truth. An agent can read the loaded log,
change what the app displays, and (via open / source_root) switch which log, processor or source
roots are open — the same things you change through the UI. File writes are off by default: the
screenshot / report verbs work only after you enable Allow assistant file exchange (Settings ▸ Assistant),
write only inside the exchange directory you configure, and never overwrite. It cannot touch your
API key, run anything, or read files outside the log and sources you configured. Server control is
deliberately not an assistant capability. The channel is loopback-only and the endpoint file is
owner-readable. (The FAQ's security answer
is the canonical statement of this boundary.)
Saved charts before opening a log
context.savedGraphs lists the configured chart definitions with their names, series, expressions,
open-tab state and input status. Without a log they say waiting for input; with one they still say
that bindings require validation. context.graphs remains the list of live chart tabs. People see the
same distinction in the Project panel's Saved charts section.
The project may also declare processor intent through context.processorDeclarations: a named generated
class, a runtime processor with no fixed generated class, or a type not yet specified. The Project panel
and project landing show these declarations independently of source discovery and loaded run evidence.
Opening a project with no log now shows its own declarations and saved charts on the start page, with
explicit buttons to open a log, topology, design or diagnostics. This does not run a build or application.
Explicit session restoration
Read context.restoration before attempting recovery. open {restore: "last"} accepts the current
project's offer; open {restore: "dismiss"} declines it. Send either alone. Verification and file opens
are asynchronous: wait for state: "finished" or "unavailable" and read message and checks.
A superseding open returns recovery to "offered"; it has not restored the session. The generation
identifies the rendered offer, and start-page buttons retain it to reject stale clicks. MCP requests
address the current offer when handled.
A successful request echo is not an assertion that every saved input opened. Recovery does not execute
application logic. The human sees the same offer on the start page and the same status in the Project
panel. Identity and partial-restoration rules.
The start page's Author a new project action and File ▸ New project from template share one catalogue and download flow. All entries remain visible; recommendation tags do not establish key requirements or agent readiness. Check the declared entry files against the downloaded project. A walkthrough is an optional runbook exercise, not a separate analyser execution mode.