svc-admin-web
Browser-based admin & monitoring console for a running Mongoose server. Presentation layer over AdminCommandRegistry — the same command surface that svc-admin-telnet and svc-admin-rest drive — plus a dashboard, live JVM monitor over WebSocket, an interactive command terminal, a streaming log tail, and a dispatcher topology graph (with per-processor graphml drilldown).
Frontend is plain HTML/CSS/JS with htmx 2.0.4 + Alpine.js 3.14.8 vendored under /vendor/. The Topology + Processor-graph views additionally lazy-load cytoscape 3.33 + dagre layout the first time they are opened, so the initial bundle stays small. Single jar, no Node toolchain, works offline.
<dependency>
    <groupId>com.telamin</groupId>
    <artifactId>svc-admin-web</artifactId>
    <version>1.0.35</version>
</dependency>
What you get
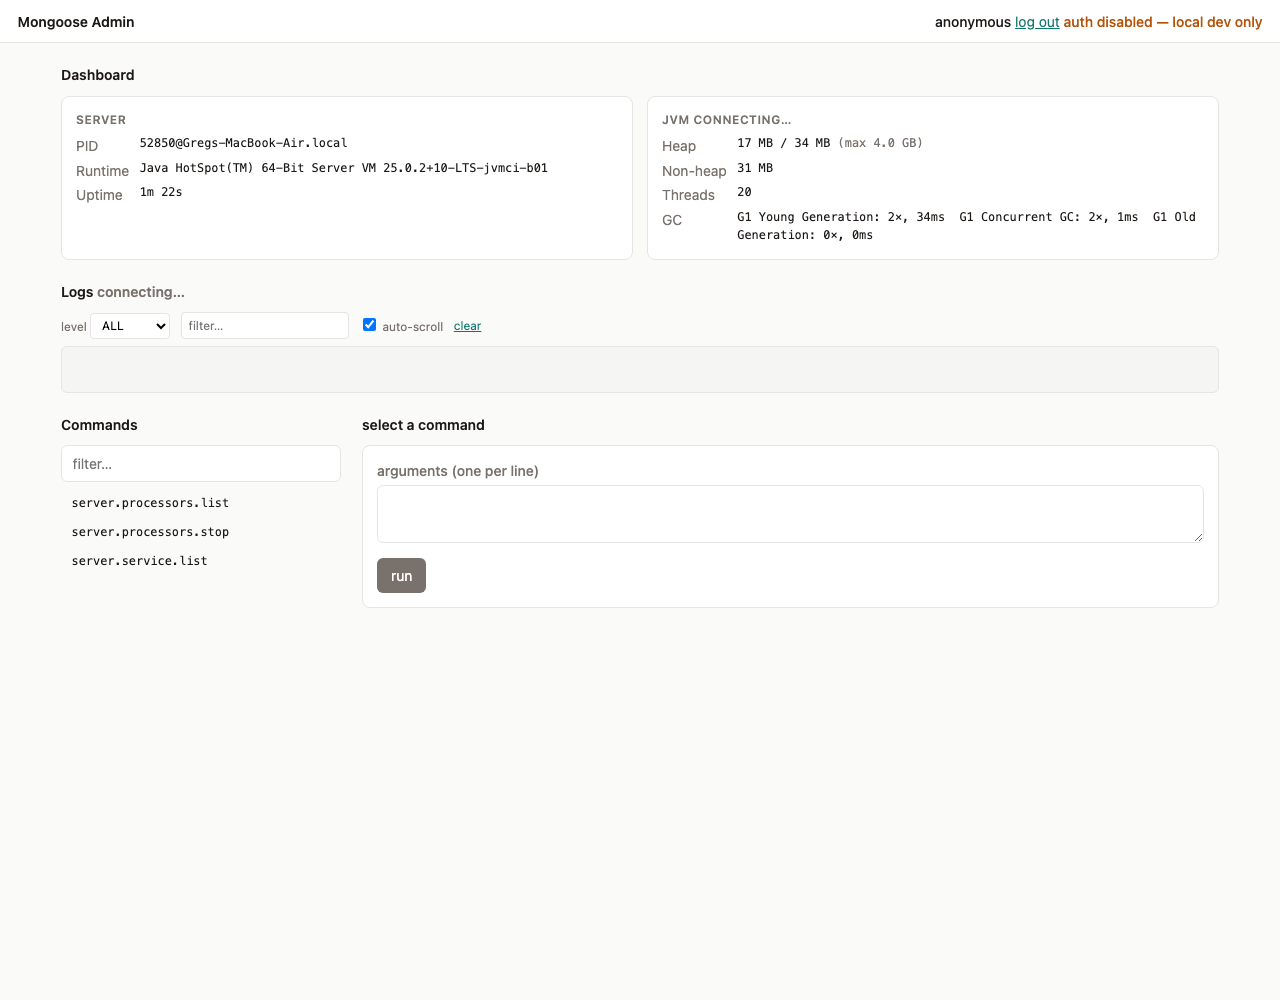
- Dashboard — server identity (pid, runtime, uptime) and live JVM stats (heap, non-heap, threads, GC) pushed over WebSocket. Includes a Refresh dropdown (1 / 2 / 5 / 10 / 30 s, plus Off) that throttles the server-side sampler. When mongoose
performanceMonitoring.enabled: trueis set, a Throughput card shows live per-feed / per-group / per-processor rates plus a per-queue depth table — every name links into the matching detail page. With monitoring off, the card is replaced with an honest "monitoring is off" hint and the YAML key to flip. - Commands — filterable list of every command registered with
AdminCommandRegistry, args form, captured stdout/stderr, replay-able history. - Console — interactive terminal: type commands directly, Tab to autocomplete from the registered list, ↑/↓ to recall history.
- Logs — bounded ring buffer of recent
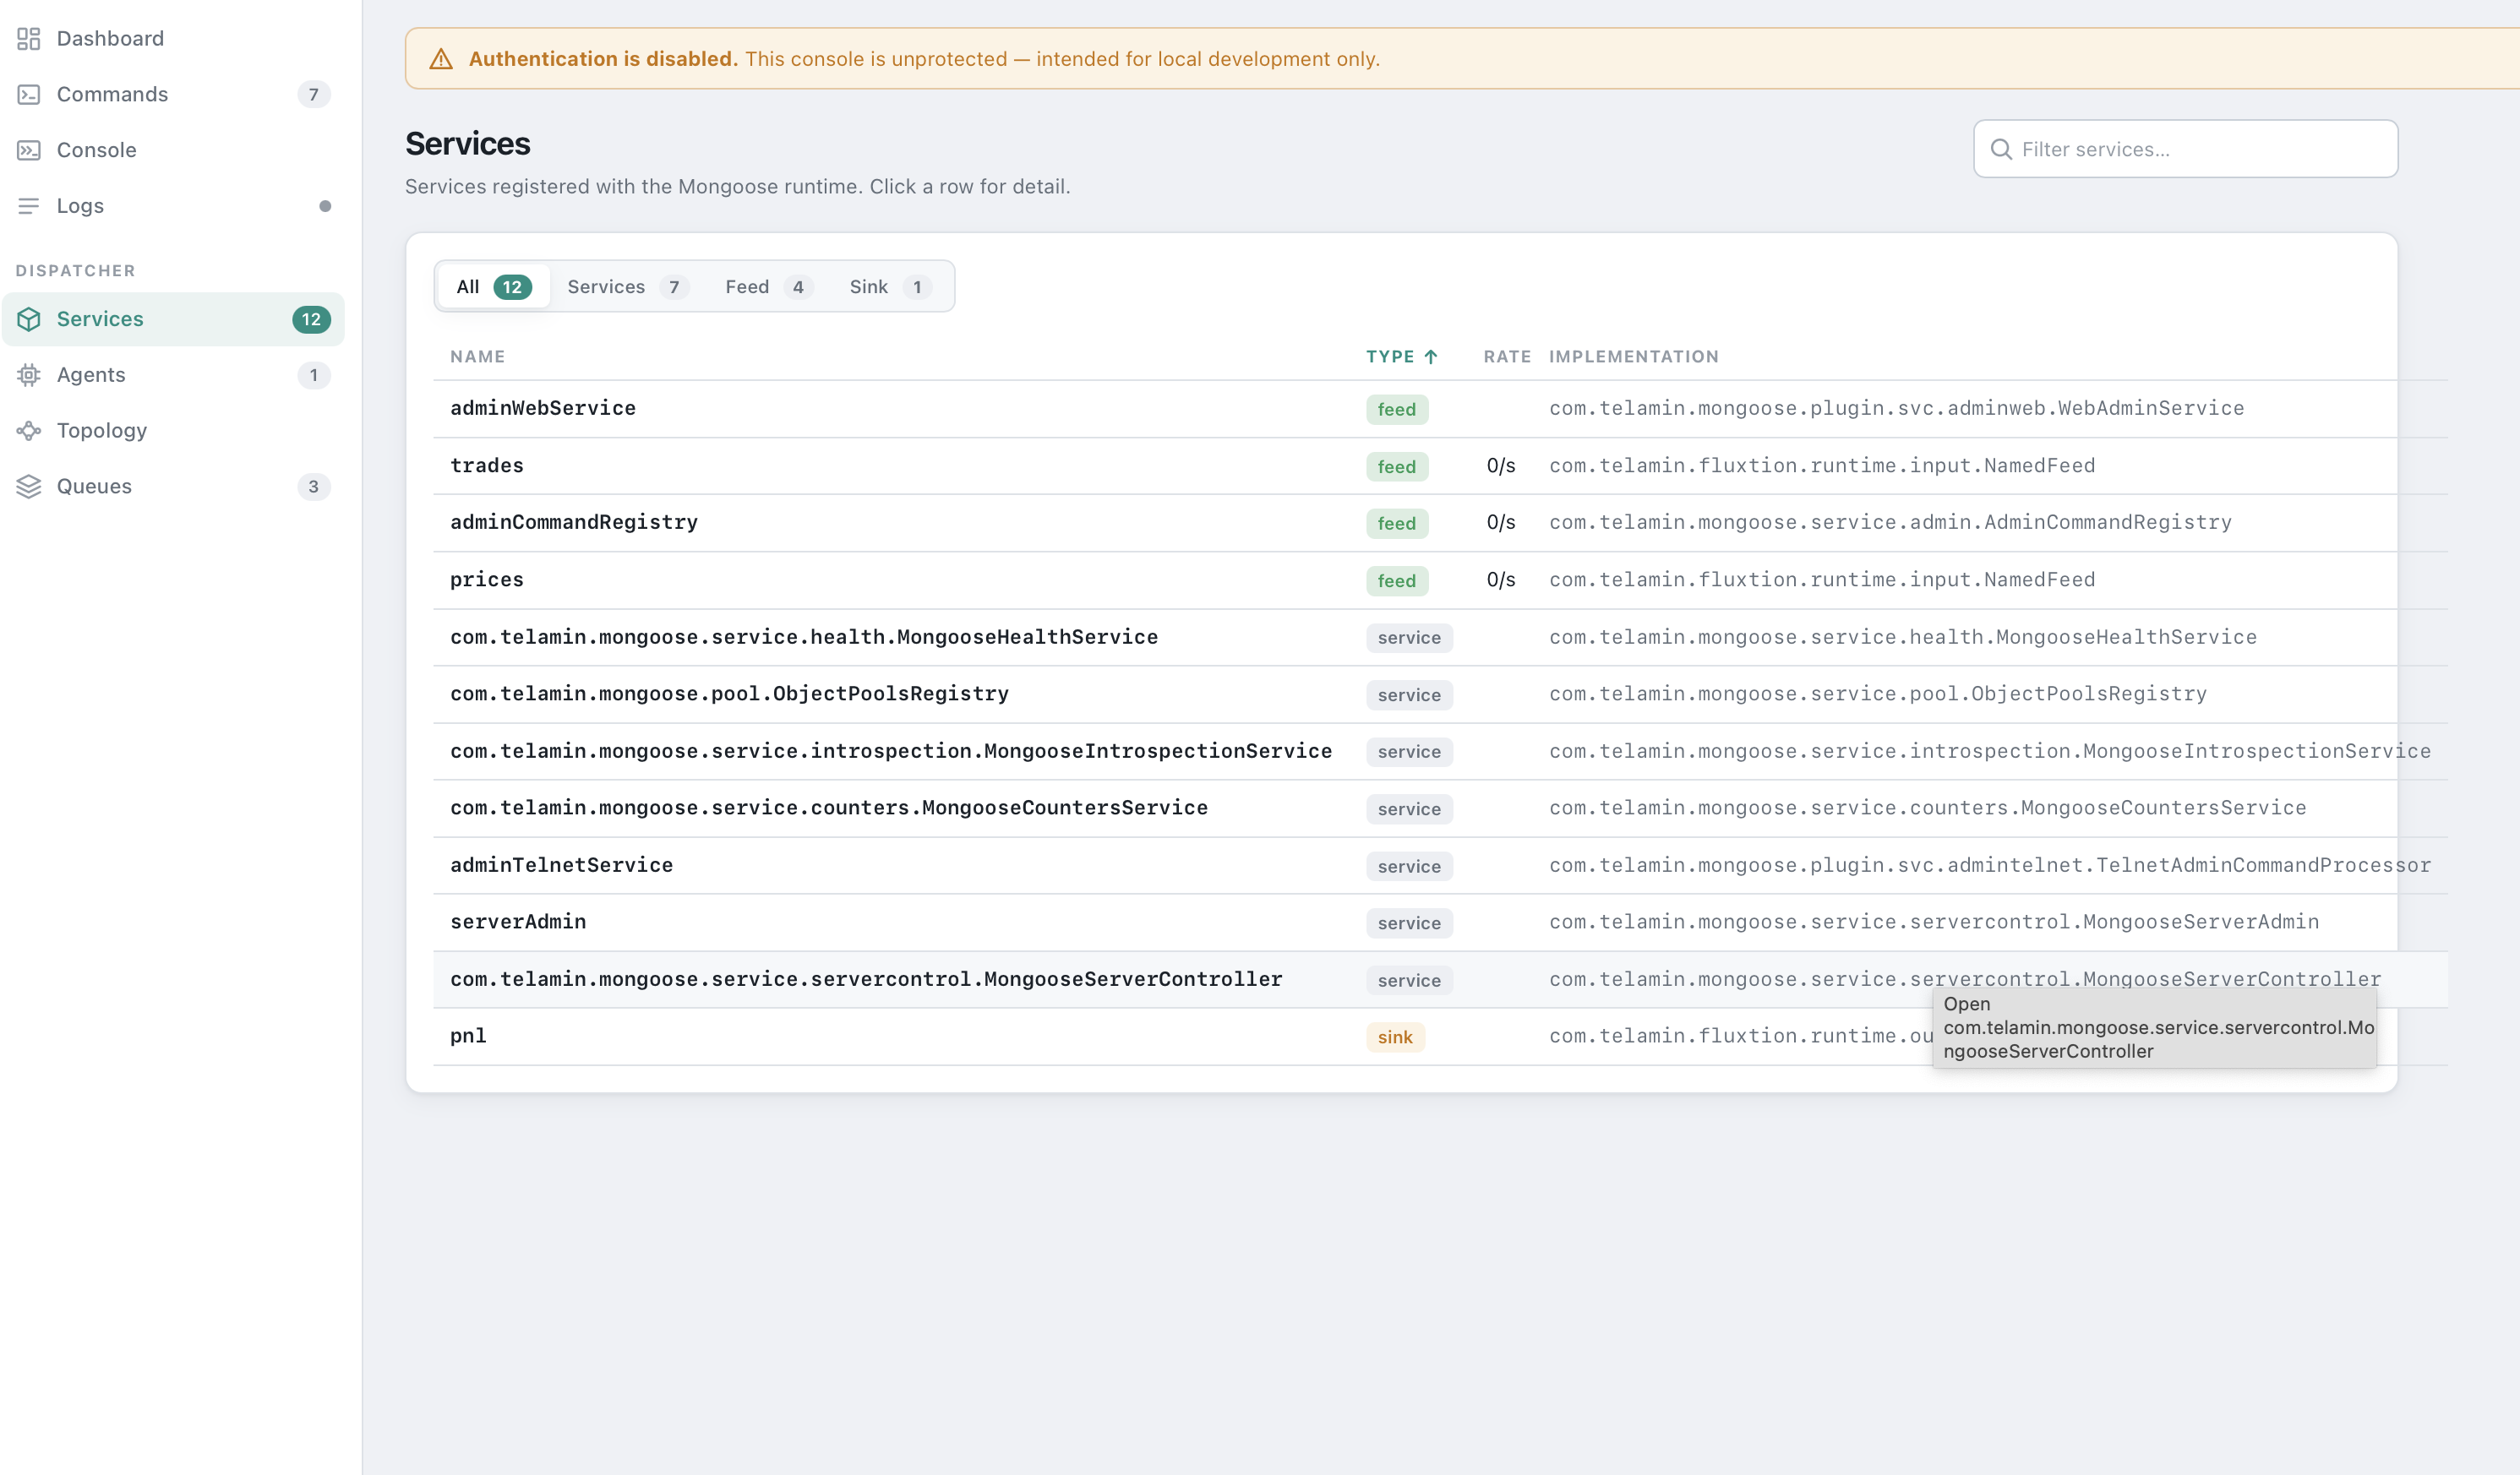
java.util.loggingrecords streamed live; level filter, substring filter, auto-scroll. - Services / Agents / Queues (conditional) — dispatcher introspection. Services classifies each entry as
feed/sink/service, cross-links to its consumers, exposes a Configuration card (reflective public-getter view, sensitive values masked), and — when performance monitoring is on — a per-row Rate column on the list plus a Performance card on the detail page (rate + total published for feeds).
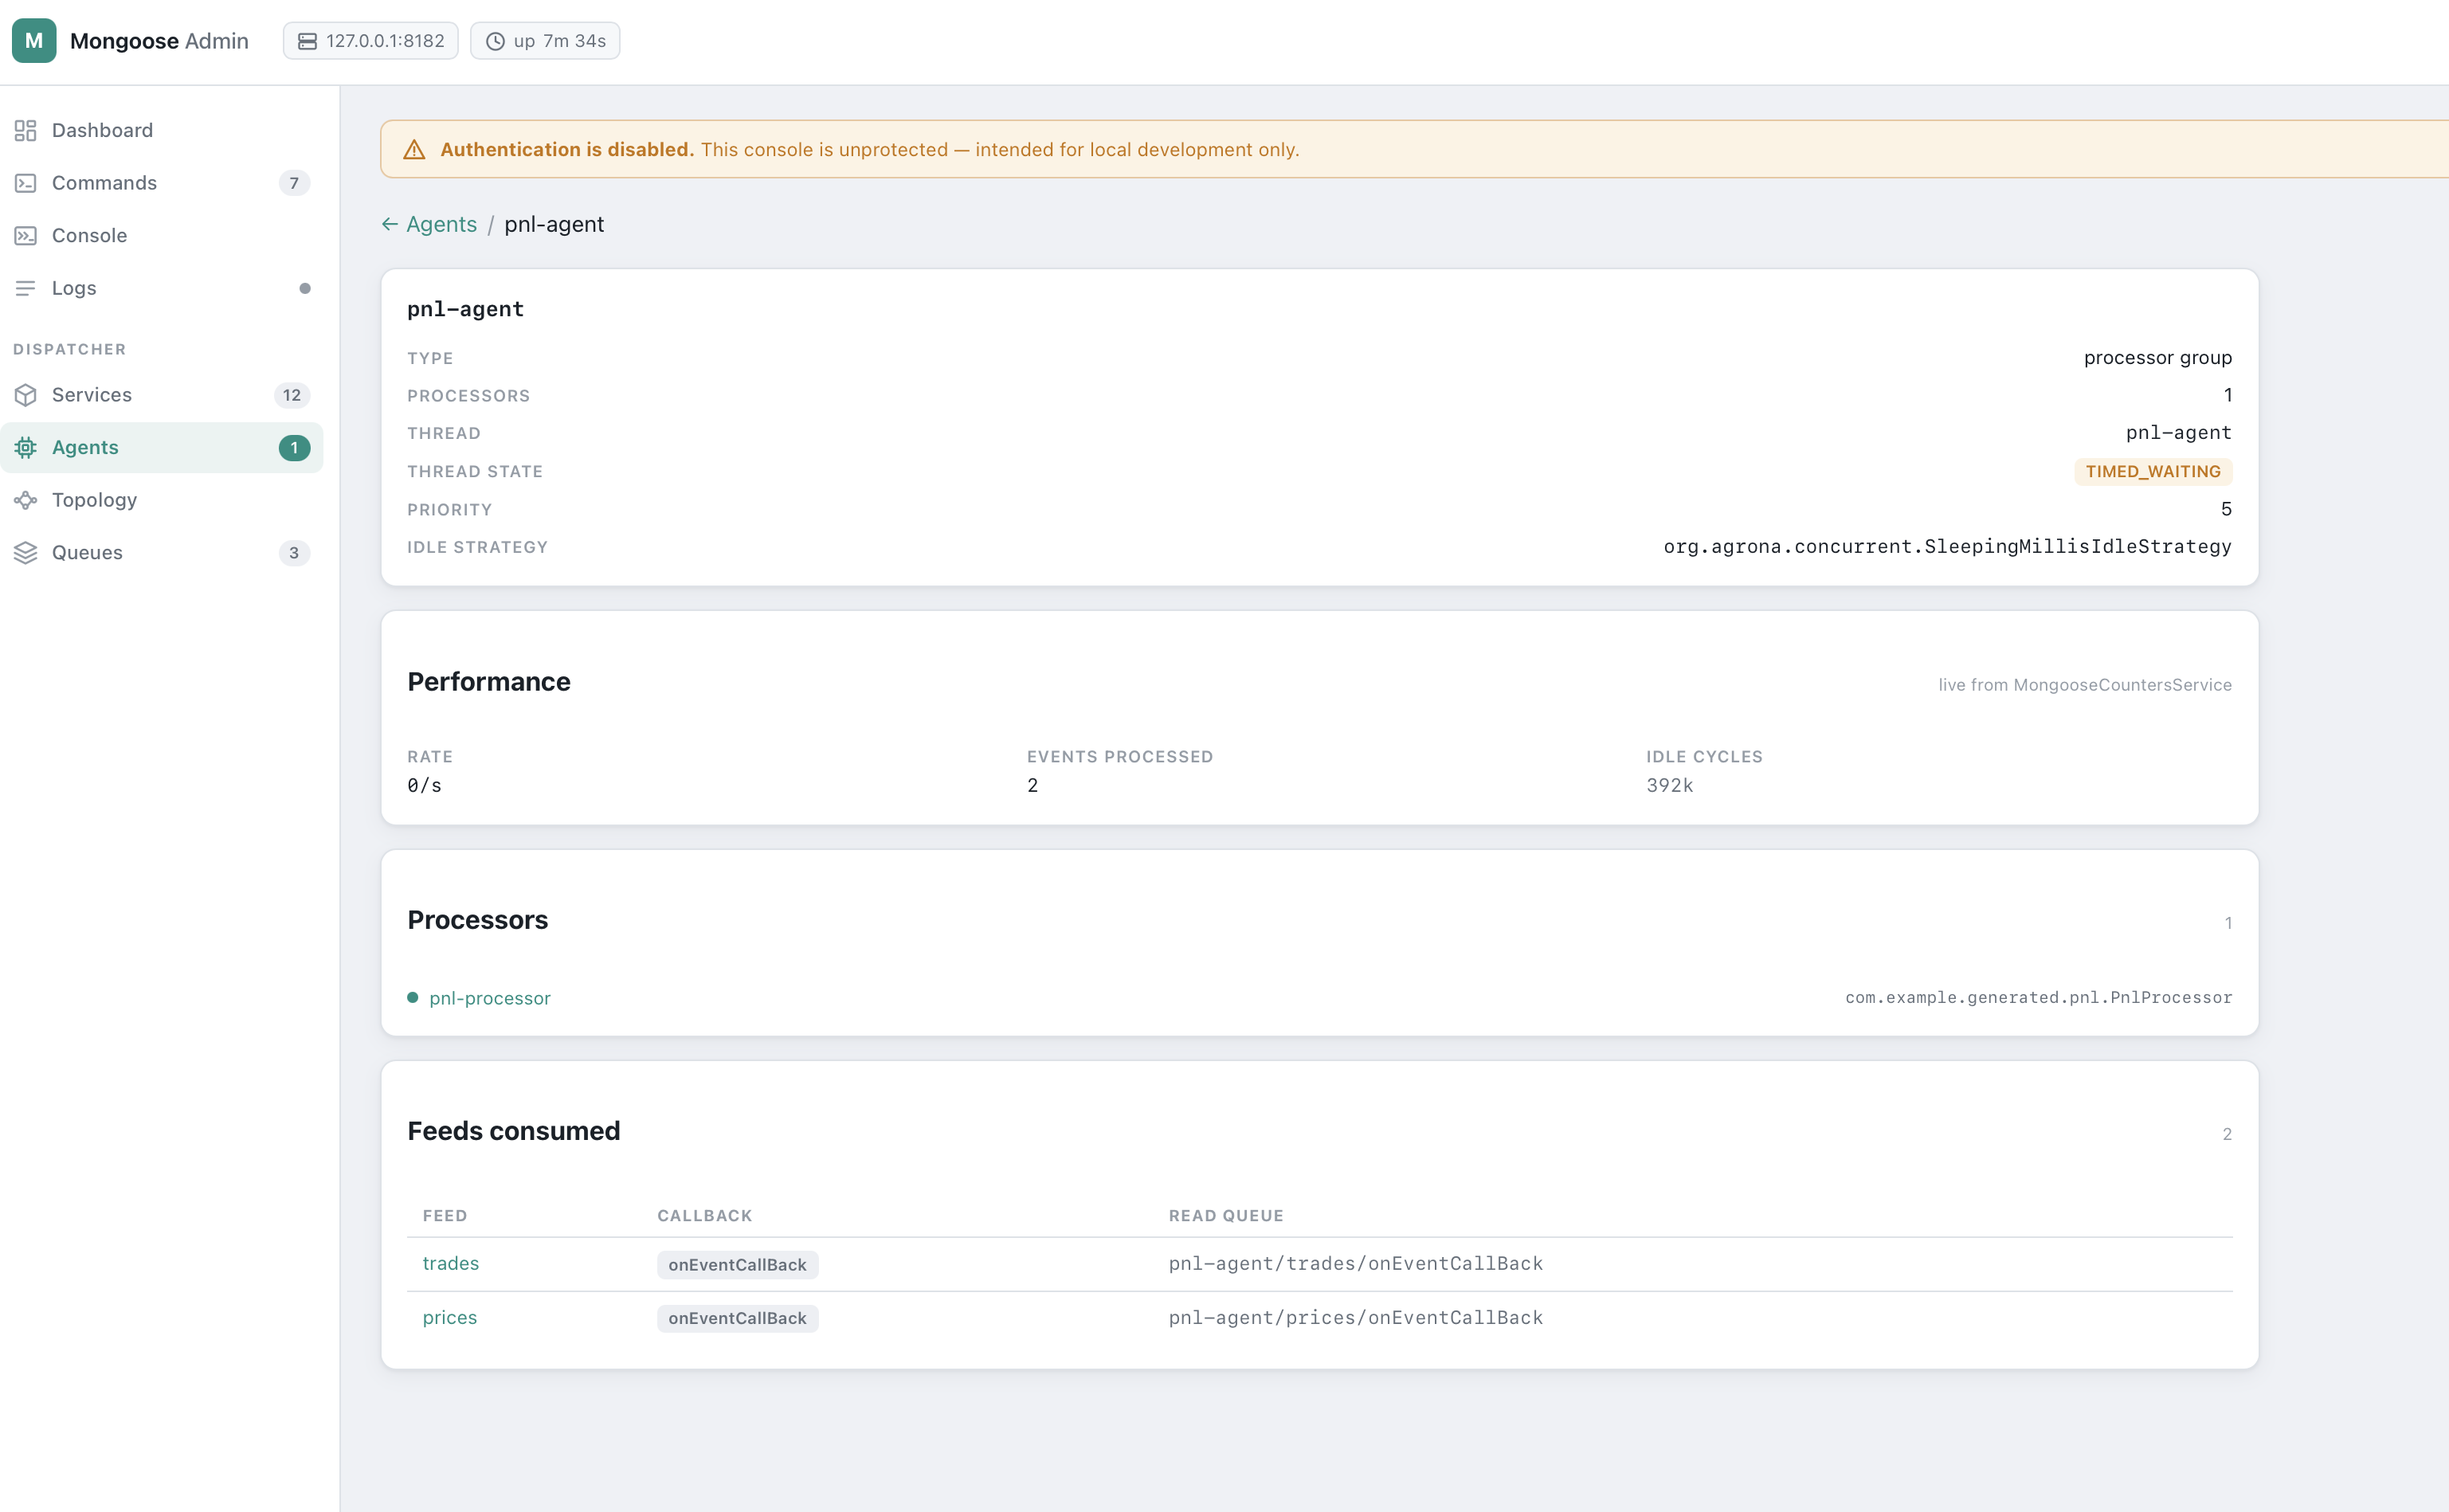
Agents surfaces thread name, state, idle strategy, per-processor feed subscriptions, an inline rate tag on each card head, and a Performance card on the detail page (rate + events processed + idle cycles).
Queues renders the EventFlowManager topology with a Consumer column linking each queue back to its consuming agent group.
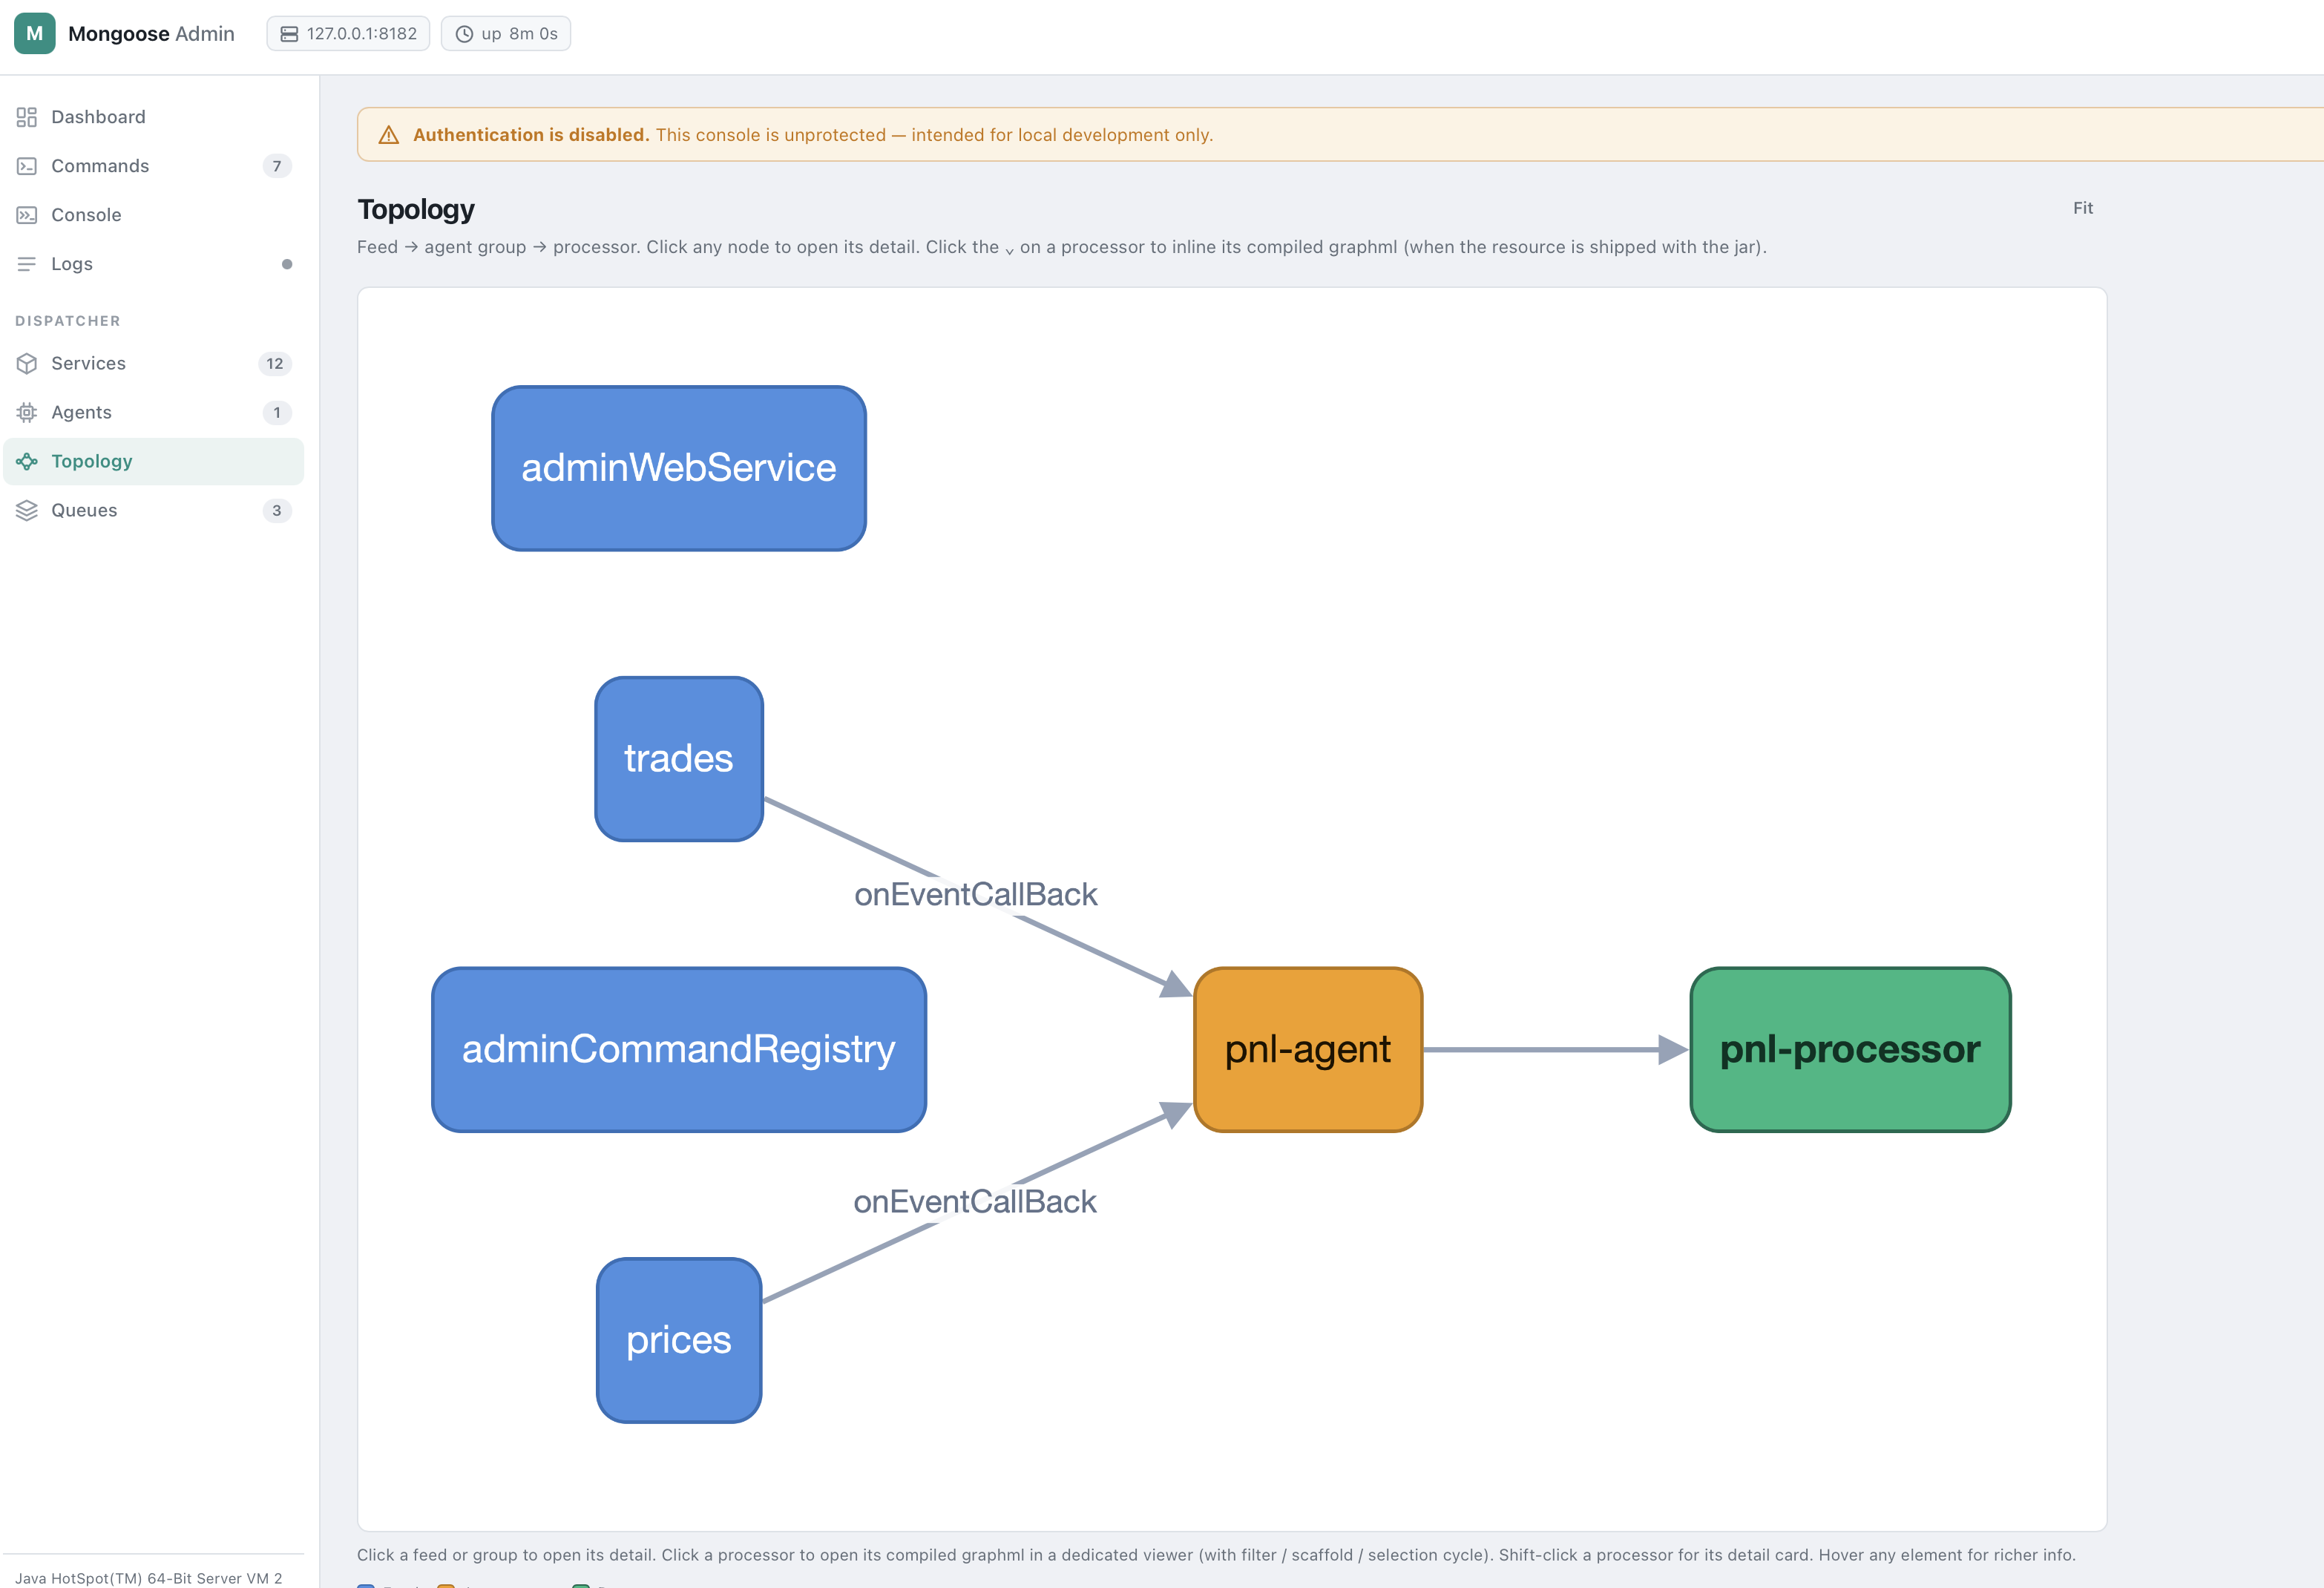
- Topology (conditional) — lazy-loaded cytoscape DAG of feed → agent group → processor. Click a feed/group to open its detail; click a processor to open its compiled graphml in a dedicated viewer. When performance monitoring is on, feed and group nodes pulse green for ~800 ms each time their rate ticks above zero — visible heartbeat of the running pipeline.
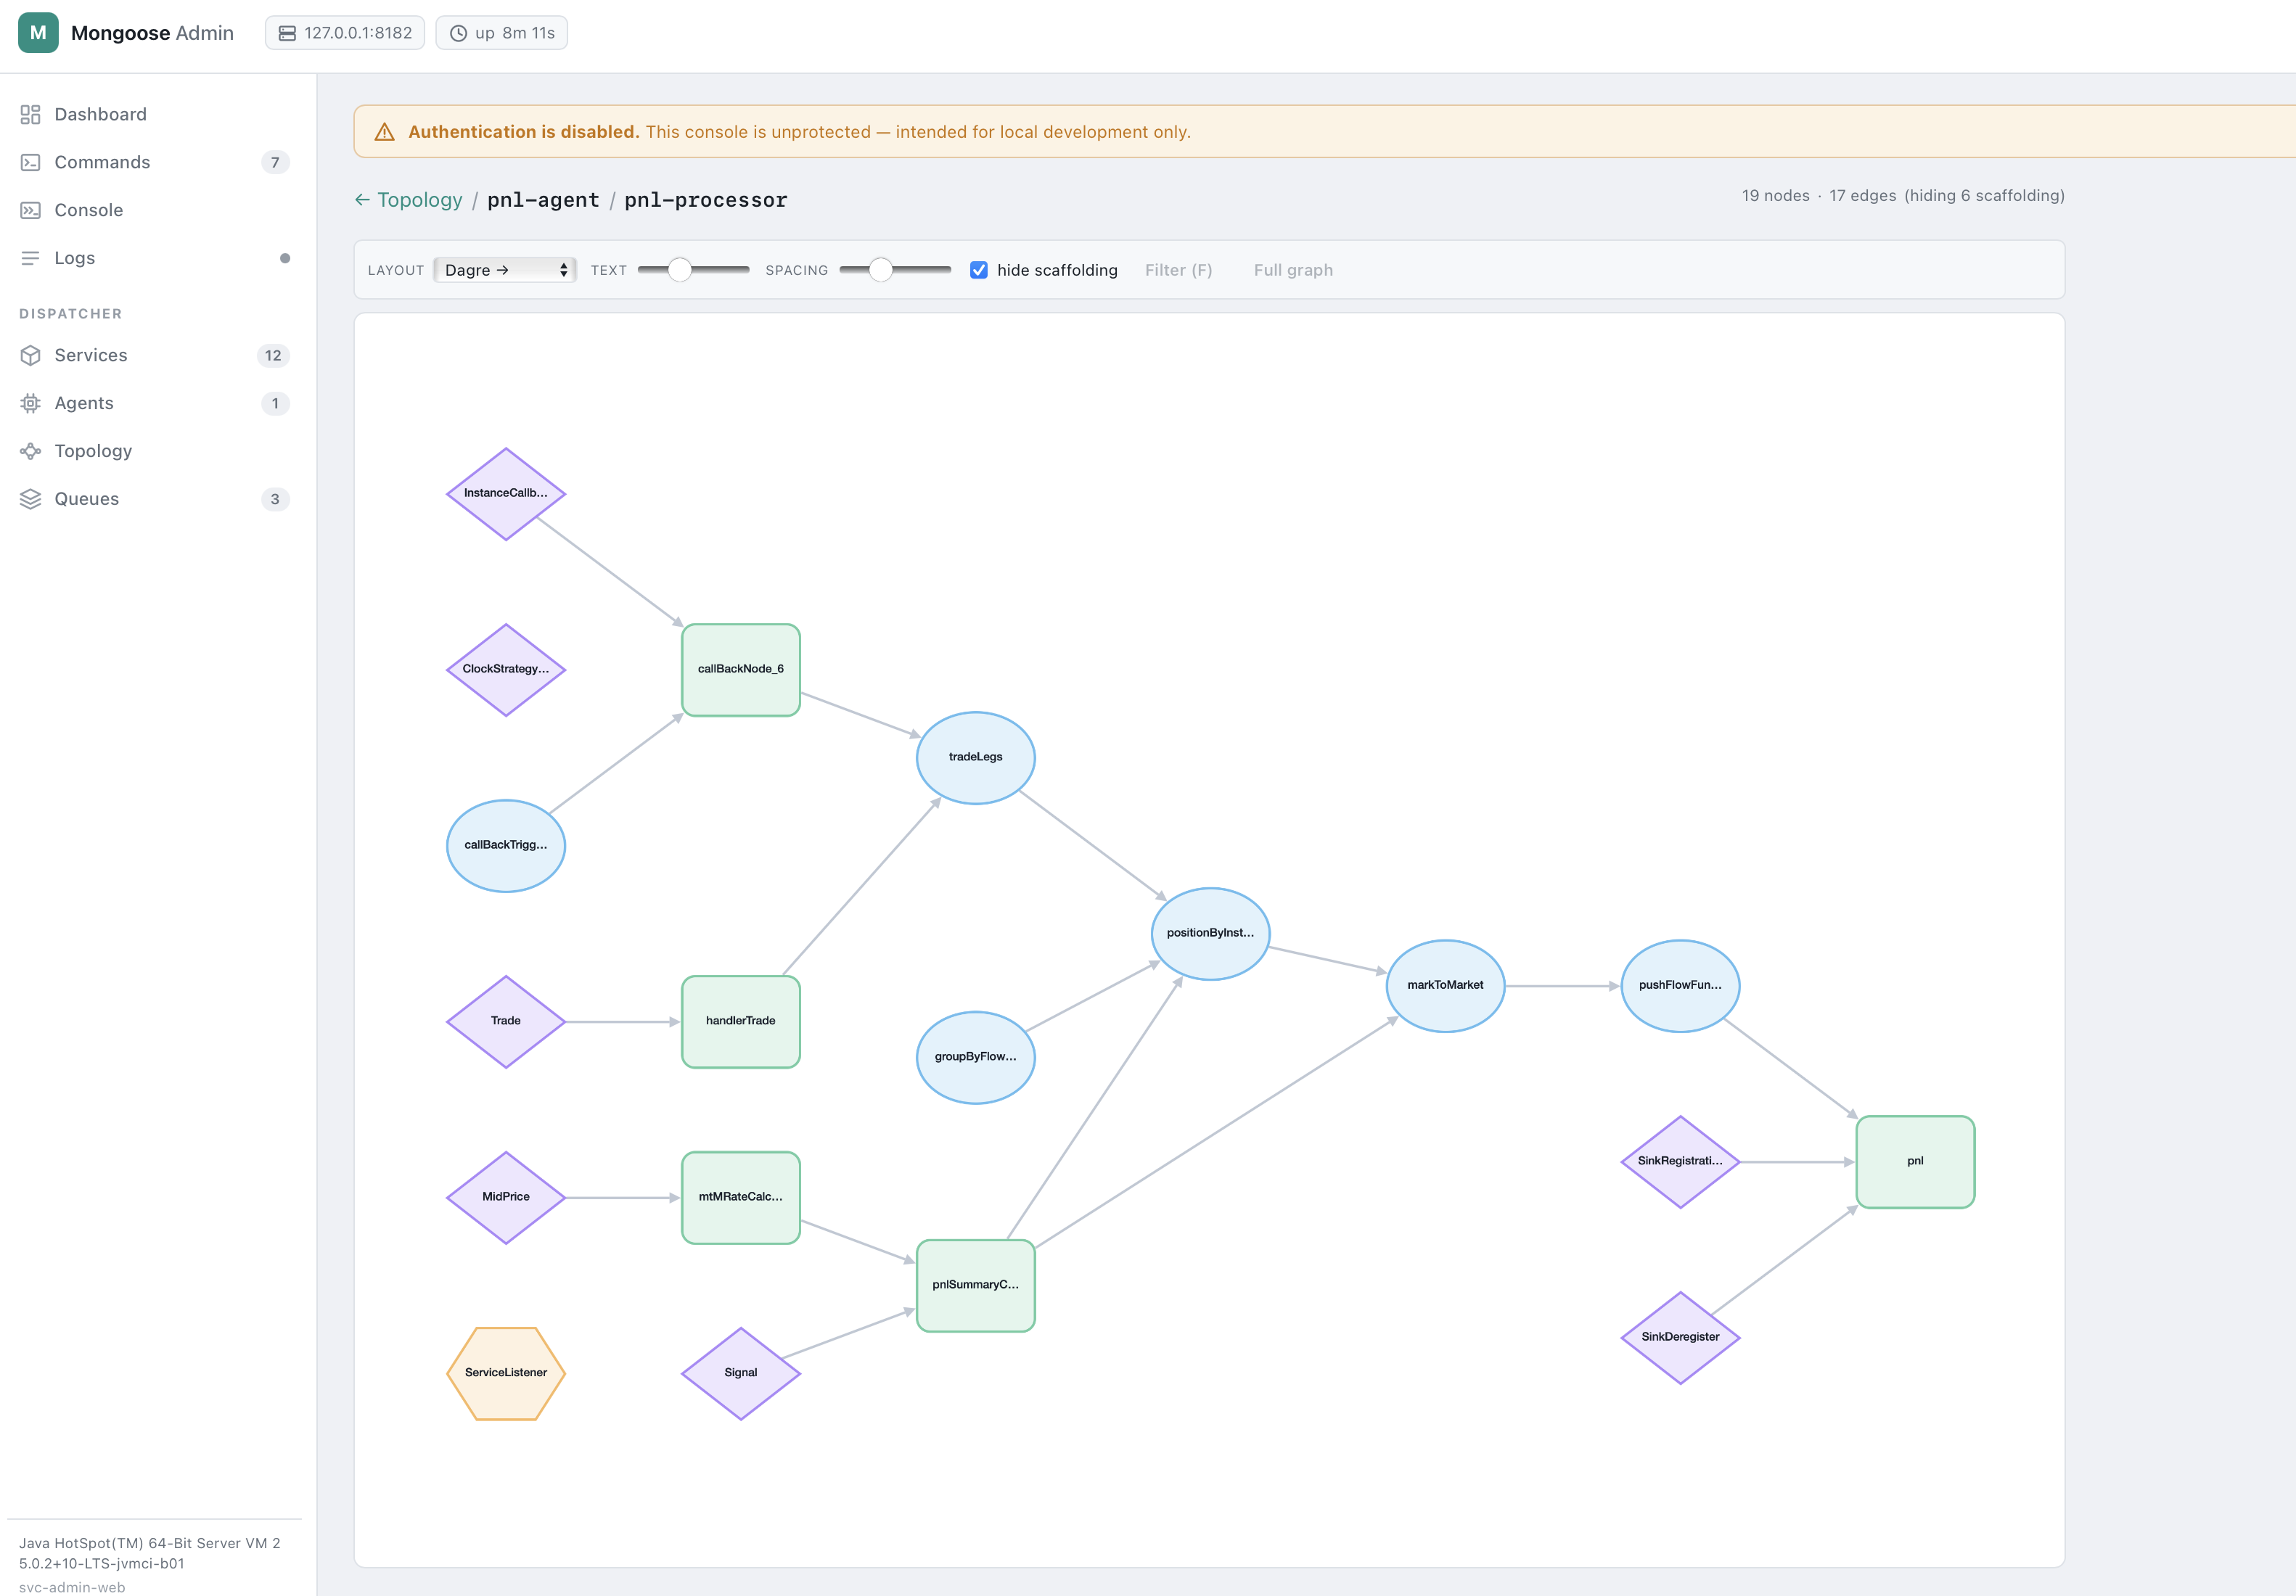
- Processor graph — full Fluxtion-style graphml viewer for a single processor: layout switcher, font + spacing sliders, Hide scaffolding toggle, click-to-cycle selection (focus → 1-hop neighbours → execution path → whole graph), Filter (F) to redraw on the current selection, Full graph to clear. When a
PerformanceMonitorAuditis bound to the processor at build time, the sub-detail panel shows a Per-node invocations table — every node in the generated SEP with its live invocation count. The graphml is loaded from<class-FQN-with-/>.graphmlon the processor's classloader; missing-resource state surfaces a guided "copy this file intosrc/main/resources/..." panel.
 - Cache panel (conditional) — when
 cache.* commands are present, surfaces cache.list, cache.{name}.keys, cache.{name}.get as inline forms.
- Loader panel (conditional) — when yamlLoader.* or springLoader.* commands are present, surfaces compileProcessor forms with a file picker scoped to loaderBaseDir.
Panels are pure discovery — Services / Agents appear when a MongooseServerController is wired (always true on a real server), Topology appears when both Services and Agents are available, Cache / Loader appear when their commands are registered. No hard dependency on svc-cache, the loaders, or any specific plugin.
Introspection service
When the server exposes MongooseIntrospectionService (auto-registered by MongooseServer in current builds), the Agents view shows precise per-processor subscriptions and the Topology / Processor graph views work end-to-end. Older mongoose builds without the introspection surface fall back to text-parsing EventFlowManager.appendQueueInformation() and a group-fanout caveat is rendered in the UI.
Endpoints
| Method | Path | Auth | Effect |
|---|---|---|---|
GET |
/healthz |
none | Liveness probe — always 200 OK |
GET |
/ |
SPA | SPA shell (index.html + /app.js + /style.css) |
GET |
/api/commands |
yes | Lists registered admin commands |
POST |
/api/commands/{name} |
yes + CSRF | Invokes an admin command |
GET |
/api/server |
yes | Server identity (pid, runtime, startTime) |
GET |
/api/jvm |
yes | One-shot JVM snapshot |
GET |
/api/services |
yes | Service inventory; feeds carry their consumers |
GET |
/api/services/{name}/config |
yes | Reflective key/value config for a service |
GET |
/api/agents |
yes | Agent groups: thread, idle strategy, processors, subscriptions |
GET |
/api/queues |
yes | Per-feed read-queue topology |
GET |
/api/processors/{group}/{name}/graphml |
yes | Fluxtion graphml for an event processor; 404 with expectedResource + hint when the file is not shipped |
GET |
/api/files |
yes | File-picker entries; 404 when loaderBaseDir unset |
POST |
/api/session/login |
per mode | Exchanges credentials for an HMAC-signed cookie + CSRF token |
POST |
/api/session/logout |
yes + CSRF | Invalidates the session cookie |
WS |
/ws/monitor |
yes + CSRF | Pushes JVM snapshots at the rate the client requests; see Monitor WS protocol |
WS |
/ws/logs |
yes + CSRF | Replays buffered log records, then pushes live |
CSRF on WebSocket upgrades is carried as ?csrf=... query param (browsers cannot add headers to the WS handshake).
Monitor WS protocol
After connecting to /ws/monitor, the client may send text messages to control the sample rate:
{"op":"rate","ms":5000}   // sample every 5s for this client
{"op":"rate","ms":0}      // pause this client (sampler stops if every client is paused)
ms is clamped to metricsIntervalMs (the operator floor) — the dashboard cannot drive the server below the configured minimum. The effective sampler period is the min across all connected clients; when every client is off, the sampler does not allocate snapshots at all. The dashboard's Refresh dropdown is the UI surface for this protocol.
Graphml convention
GET /api/processors/{group}/{name}/graphml loads from the processor's own classloader at the resource path <class-FQN-with-slashes>.graphml. For a processor whose class is com.example.generated.pnl.PnlProcessor, ship the file at src/main/resources/com/example/generated/pnl/PnlProcessor.graphml. When the resource is absent the response is 404 with a structured body — the UI uses that body to surface "expected <path>; copy the Fluxtion-generated .graphml into your src/main/resources/..." guidance.
Sample
services:
  - name: adminWebService
    service: !!com.telamin.mongoose.plugin.svc.adminweb.WebAdminService
      host: 127.0.0.1
      listenPort: 8181
      authMode: BASIC
      username: $ENV.ADMIN_USER
      password: $ENV.ADMIN_PASSWORD
      realm: mongoose-admin
      sessionSecret: $ENV.MONGOOSE_ADMIN_SESSION_SECRET
      sessionMinutes: 60
      metricsIntervalMs: 1000
      logTailBuffer: 500
      loaderBaseDir: /etc/mongoose/configs
Then point a browser at http://127.0.0.1:8181/.
Authentication
authMode |
Required config | Browser flow |
|---|---|---|
NONE (default) |
— | UI shows an "auth disabled" warning; anonymous session for CSRF |
BASIC |
username, password |
Sign-in form; backend accepts Authorization: Basic |
BEARER |
bearerToken |
Token field; backend accepts Authorization: Bearer |
- Credentials, bearer token, and
sessionSecretall support$ENV.NAMEresolution. - Comparisons are constant-time.
init()fails fast withIllegalStateExceptionif you selectBASIC/BEARERbut leave credentials empty.- Sessions are HMAC-signed cookies (
HttpOnly,SameSite=Strict,Securewhen behind TLS). No server-side session table; restart invalidates all sessions unlesssessionSecretis pinned via env. - WS upgrades enforce the same auth + an
Originallow-list (same host:port by default).
Security model
- CSRF — every state-changing request must carry
X-CSRF-Tokenmatching the token in the session cookie. WS upgrades carry it as?csrf=.... - Origin allow-list — WS upgrades reject
Originheaders that don't match the configured bind host:port. - Path traversal —
/api/filesrejects absolute paths and..segments at the front gate; afterresolveit re-checks withtoRealPath()+startsWith(base)to catch symlink escapes.
Configuration reference
| Field | Default | Notes |
|---|---|---|
host |
127.0.0.1 |
Bind address — defaults to loopback |
listenPort |
8181 |
TCP port |
basePath |
/ |
Mount point for the SPA |
authMode |
NONE |
NONE, BASIC, BEARER |
username |
unset | BASIC credential ($ENV. resolvable) |
password |
unset | BASIC credential ($ENV. resolvable) |
bearerToken |
unset | BEARER credential ($ENV. resolvable) |
realm |
mongoose-admin |
WWW-Authenticate realm |
sessionSecret |
random per-JVM | HMAC key ($ENV. resolvable). Pin to survive restarts. |
sessionMinutes |
60 |
Cookie lifetime |
metricsIntervalMs |
1000 |
Sampler period (clamped ≥ 250 ms) |
logTailBuffer |
500 |
Max retained log records |
loaderBaseDir |
unset | Root for the file picker. Unset → /api/files returns 404. |
Operational notes
- Implements
EventFlowService<Object>but is not an event source —subscribe/unSubscribe/setEventToQueuePublisherare no-ops. - Default
hostis127.0.0.1. For multi-host access, change explicitly and front with TLS. - Javalin uses SLF4J; add a binding (e.g.
log4j-slf4j2-impl) to silence "no logger" notices in production.
Performance monitoring
When the mongoose server is booted with performanceMonitoring.enabled: true in its YAML, svc-admin-web's sampler reads MongooseCountersService.forEachCounter on every tick, computes per-counter rates against the previous snapshot, and bundles the result into the /ws/monitor payload's throughput field. The Dashboard renders it as the Throughput card; Services / Agents / Topology / Processor views light up with the per-entity slices, and feed / group nodes on the Topology pulse green on each non-zero rate tick.
See the mongoose how-to: enabling performance monitoring for the YAML toggle, the built-in counter sites, and the PerformanceMonitorAudit builder helper that adds per-processor + per-node counts.
Pre-requisite: mongoose-core ≥ 1.0.13 (counters service introduced in that release).
Examples
- mongoose-plugins/example/admin-web-example — standalone boot harness with
AdminCommandProcessor+MongooseServerAdminso the UI has three real commands on first run.